Mutation detection sensitivity of high resolution melting in clinical samples: a comparative study between formamide and dimethyl sulfoxide
Abstract
High-resolution melting (HRM) is one of the widely used methods for mutation detection. Sometimes, mutations which are rare but clinically important may not be detected. Thus, increasing sensitivity of HRM based mutation detection method is essential. This study was particularly aimed to establish HRM based mutation detection method with improved sensitivity. However, we had taken an attempt to detect the mutations in transcription factor 7-like 2 (TCF7L2) gene by HRM analysis but we experienced poor sensitivity in mutation detection. Hence, we tried to increase the sensitivity of HRM by adding formamide and dimethyl sulfoxide (DMSO). We used the final concentration of formamide and DMSO at 0.2% and 7%, respectively and found that formamide had better efficacy in increasing HRM sensitivity than DMSO.
INTRODUCTION
High-resolution melting (HRM) are commonly used in clinical applications for mutation detection [1-2]. HRM is normally conducted in a post-PCR fashion and can be easily done in a routine laboratory with a real-time PCR machine. However, PCR-HRM may often miss mutations which are less abundant than approximately 3%–10% [3] that may be clinically significant. Therefore, increasing detection sensitivity in HRM mutation scanning can amplify its clinical value. Correct execution of a HRM genotyping experiment include type and quality of DNA material, template DNA preparation, primer and amplicon design, and pipetting consistencies, as well as physical limitations in melting curve distinction for alternative variants [3].
HRM analysis of GC rich sequence is often a challenge due to its high stringency of hydrogen bonds. Dimethyl sulfoxide (DMSO) is used for increasing the amplification efficiency of GC-rich sequences [4-5], because it helps open up secondary structures and weaken hydrogen bonds between base pairs [6-7]. Formamide is another chemical added in PCR and was expected to mimic the effect like DMSO. However, both formamide and DMSO were previously shown to improve thermal profile of DNA sample in similar manner [8].
Thus, we designed this study to examine and compared the effect of both by adding DMSO (7%) and formamide (0.2%) to our HRM reaction.
MATERIALS AND METHODS
Chemicals and reagents
Formamide (≥99.5%, BioScience-Grade, RNAse/ DNAse-free) and DMSO (≥99.5%, BioScience-Grade, for molecular biology) were bought from Carl Roth (German). GoTaq® qPCR master mix (2X) were collected from Promega (USA). Sodium acetate, ethanol, and glycogen were from Sigma-Aldrich (USA). Primer was custom synthesized from IDT (Integrated DNA Technologies), Malaysia.
Sample collection, DNA isolation and purification
This study included blood sample of 657 Bangladeshi individuals consisting 327 of type 2 diabetic patients and 330 of non-diabetic individual. The blood samples were collected to study the correlation between type 2 diabetes and TCF7L2 polymorphism. In this regard, consent of the individuals was taken. Approval regarding this study was given by the Institutional Animal, Medical Ethics, Biosafety and Biosecurity Committee (IAMEBBC) for Experimentations on Animal, Human, Microbes and Living Natural Sources (Memo number: 58/320/IAMEBBC/IBSc), Institute of Biological Sciences (IBSc), University of Rajshahi, Rajshahi, Bangladesh. However, isolation of genomic DNA was carried out by using Blood DNA Preparation Kit (Jena Bioscience, German) according to the manufacturer’s protocol. Then the isolated DNA samples were subjected to purification. 200 µL of DNA sample (previously dissolved in distilled water) was taken in 1.5 mL micro-centrifuge tube and 100 µL CHCl3 was added. Then 100 µL phenol was added slowly prior to vortex. The mixture was then spun at 13000 rpm for 5 min and 200 µL supernatant was transferred in a new 1.5 mL micro-centrifuge tube. Sodium acetate (20 µL), ethanol (550 µL), and glycogen (3 µL) were added with the supernatant and placed at -10°C for 30 min. The mixture was centrifuged at 13000 rpm for 10 min and the supernatant was discarded. A washing step with 70% ethanol was followed and the pellet was left to dry. Finally, the DNA pellet was dissolved in distilled water and the concentration of each sample was measured by using a nano-drop spectrophotometer (Nano Drop 2000, Thermo Scientific, USA). As concentration of DNA needed to be equal for HRM analysis, a template dilution series was carried out following the concentration of DNA of each sample.
Polymerase chain reaction (PCR) analysis
A gradient PCR was performed to determine the optimum annealing temperature of the new primer set. Gradient PCR was carried out by using SureCycler 8800 (Agilent Technologies, USA). The TCF7L2 primer sequence was as follows: forward: 5′-CTGTGCTGCCTAACACAACT-3’ and, reverse: 5’-GGCAAAAACGACACCTCTTG-3’. The PCR mixture (50 µL) comprises 25 µL GoTaq® Hot start PCR master mix (2X), 1 µL of both forward and reverse primer (10 mM), 1 µL of template DNA, and 22 µL of nuclease free water. Cycling conditions were initial PCR activation step of 3 min at 95°C, followed by 40 cycles of 95°C for 30 s, 55-62°C for 30 s, 72°C for 30 s and a final extension of 72°C for 10 min. Finally, PCR reactions were analyzed on 1.5% agarose gel using a gel documentation system (Red™ Imaging System, Alpha Innotech’s, USA) to check the temperature of corresponding reaction that revealed brighter band.
For confirmation that the annealing temperature was optimized, PCR was run again with the conditions in which DNA amplification was appropriately occurred in gradient PCR. Other cycling conditions were same as gradient PCR and the PCR product was checked again on 1.5% agarose gel. The size of PCR product was tracked using 1 kb plus DNA ladder (Tiangen, Beijing, China) as DNA marker.
High-resolution melting (HRM) analysis
HRM analysis was carried out by using EcoTM real-time PCR system (Illumina®, USA). The PCR mixture that served as control (10 µL) comprises 5 µL GoTaq® qPCR master mix (2X), 0.5 µL of both forward and reverse primer (10 mM), 1 µL of template DNA, and nuclease free water upto 10 µL. Other two different conditions were made by adding formamide and DMSO at 0.2% and 7% of the final concentration respectively. Cycling conditions were initial PCR step (polymerase activation) of 10 min at 95°C, followed by 40 cycles of 95°C for 10 s, 60°C for 30 s, 72°C for 15 s. PCR reaction specificity was confirmed by high resolution melt curve analysis at 95°C for 15 s, 55°C for 15 s, 95°C for 15 s.
RESULTS
Determination of optimum annealing temperature
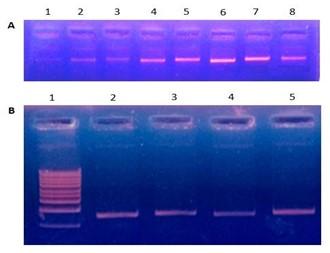
After gradient PCR with 8 different annealing temperatures (55°C to 62°C), we found that amplification of TCF7L2 primer was occurred at all temperatures except 55°C (Figure 1A). But, the highest amplification was resulted at 60°C showing the brightest band (Figure 1A).
Moreover, when we ran PCR for confirmation of annealing temperature (60°C), we observed that amplification of TCF7L2 primer was occurred in all of the replicates (Figure 1B). Thereafter, we confirmed and finalized that the annealing temperature of TCF7L2 primer was 60°C and conducted further experiment.
High-resolution melting (HRM) analysis
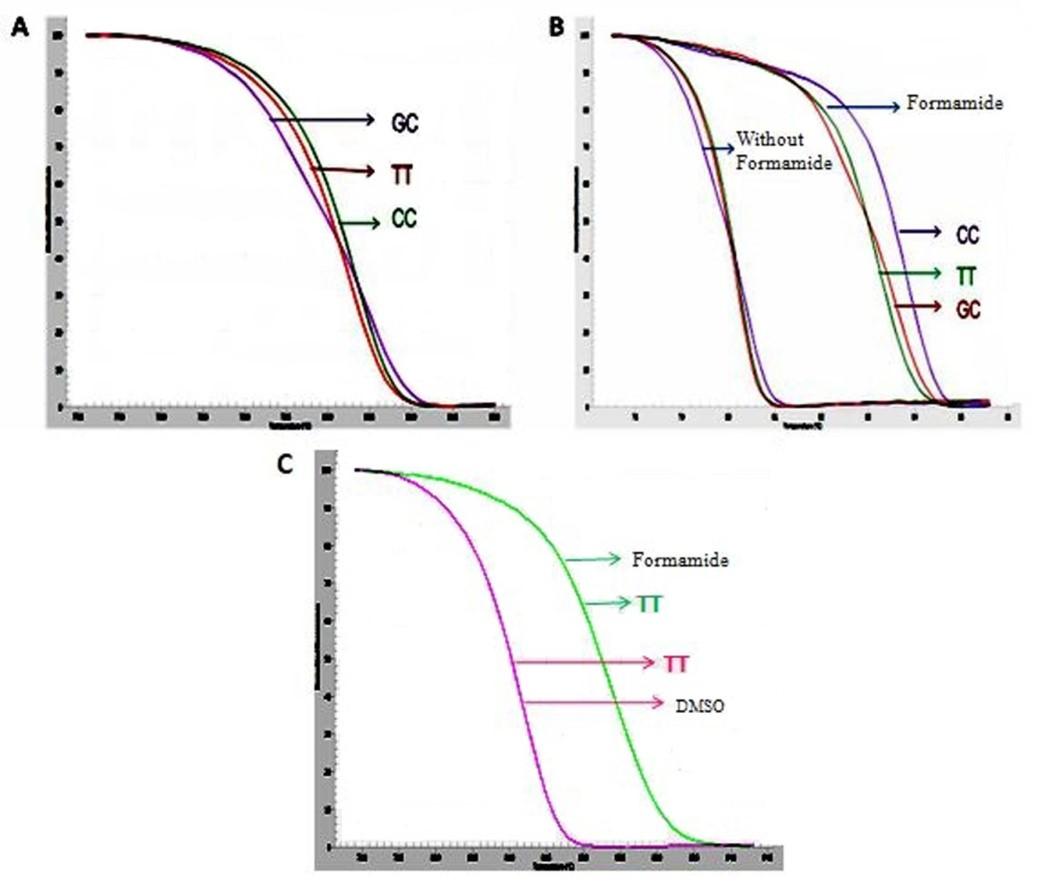
According to the result, when none of the DMSO and formamide was used (control), curves were compact and hardly distinguishable (Figure 2A). But compare to control, the curves were readily distinguishable due to using 0.2% formamide (Figure 2B). When we used both of the DMSO and formamide, the curve resulting from 7% DMSO sample was almost similar to the control, whereas 0.2% formamide containing sample revealed remarkably noticeable curve compared to 7% DMSO treated sample (Figure 2C).
DISCUSSION
Destabilization of DNA via addition of betaine before melting analysis of real-time PCR products generates a narrower melting peak for the probe-template duplex [9], whereas addition of high-salt buffer may improve clustering in HRM analysis [10]. Graziano et al., [11] demonstrated that DMSO added before melting curve analysis with the saturating dye SYBR Green I increase the separation between wild type (WT) and mutant amplicons. Because HRM uses saturating dyes for high sensitivity and reproducibility [12-13], we anticipated that addition of DMSO would have an even more pronounced effect than SYBR Green I on the thermodynamic difference between mutant and WT amplicons. Once we added DMSO to make a final concentration of 7% and formamide to make a final concentration of 0.2%, we found that both DMSO and formamide increased thermal profile of the amplicons. This finally created a physical separation of individual melting curves compared to non-treated HRM reaction. However, in terms of reproducibility and performance, we found formamide is better than DMSO.
CONCLUSIONS
The overall study may attract a great deal of attention in using formamide as a HRM sensitivity enhancer in mutation detection.
ACKNOWLEDGEMENT
This research received no external funding.
AUTHOR CONTRIBUTIONS
AH was involved in conception and design of the experiments. DR and MMH contributed to perform the experiments. AH, DR and MMH analyzed data. MMH contributed to drafting the article. AH contributed to revising it critically for important intellectual content. AH made the final approval of the version to be published.
CONFLICTS OF INTEREST
The authors declare no conflict of interest.
References
- [1]Kennerson ML, Warburton T, Nelis E, Brewer M, Polly P, De Jonghe P, Timmerman V, Nicholson GA. Mutation scanning the GJB1 gene with high-resolution melting analysis: implications for mutation scanning of genes for Charcot-Marie-Tooth disease. Clin. Chem. 2007; 53: 349-352.
- [2]Margraf RL, Mao R, Highsmith WE, Holtegaard LM, Wittwer CT. Mutation scanning of the RET protooncogene using high-resolution melting analysis. Clin. Chem. 2006; 52: 138-141.
- [3]Ney JT, Froehner S, Roesler A, Buettner R, Merkelbach-Bruse S. High-resolution melting analysis as a sensitive prescreening diagnostic tool to detect KRAS, BRAF, PIK3CA, and AKT1 mutations in formalin-fixed, paraffin-embedded tissues. Arch. Pathol. Lab. Med. 2012; 136: 983-992.
- [4]Jensen MA, Fukushima M, Davis RW. DMSO and betaine greatly improve amplification of GC-rich constructs in de novo synthesis. PLOS One. 2010; 5:e11024.
- [5]Varadaraj K, Skinner DM. Denaturants or cosolvents improve the specificity of PCR amplification of a G+ C-rich DNA using genetically engineered DNA polymerases. Gene. 1994; 140: 1-5.
- [6]Chester N, Marshak DR. Dimethyl sulfoxide-mediated primer Tm reduction: a method for analyzing the role of renaturation temperature in the polymerase chain reaction. Anal. Biochem. 1993; 209: 284-290.
- [7]Escara JF, Hutton JR. Thermal stability and renaturation of DNA in dimethyl sulfoxide solutions: acceleration of the renaturation rate. Biopolymers. 1980; 19: 1315-1327.
- [8]Song C, Castellanos-Rizaldos E, Bejar R, Ebert BL, Makrigiorgos GM. DMSO increases mutation scanning detection sensitivity of high-resolution melting in clinical samples. Clin. Chem. 2015; 61: 1354-1362.
- [9]Luo T, Jiang L, Sun W, Fu G, Mei J, Gao Q. Multiplex real-time PCR melting curve assay to detect drug-resistant mutations of Mycobacterium tuberculosis. J. Clin. Microbio. 2011; 49: 3132-3138.
- [10]Vossen RH, Aten E, Roos A, den Dunnen JT. High‐resolution melting analysis (HRMA)-more than just sequence variant screening. Hum. Mutat. 2009; 30: 860-866.
- [11]Graziano C, Giorgi M, Malentacchi C, Mattiuz PL, Porfirio B. Sequence diversity within the HA-1 gene as detected by melting temperature assay without oligonucleotide probes. BMC Med. Genet. 2005; 6: 36-41.
- [12]Wittwer CT, Reed GH, Gundry CN, Vandersteen JG, Pryor RJ. High-resolution genotyping by amplicon melting analysis using LCGreen. Clin. Chem. 2003; 49: 853-860.
- [13]Monis PT, Giglio S, Saint CP. Comparison of SYTO9 and SYBR Green I for real-time polymerase chain reaction and investigation of the effect of dye concentration on amplification and DNA melting curve analysis. Anal. Biochem. 2005; 340: 24-34.