Nutritional status and associated factors in children aged 15-17 years in a suburb in Vietnam
Abstract
A double nutritional burden (DBM) has increased rapidly in Vietnam. Finding a solution to reduce the rates of overweight & obesity and thinness was necessary, especially at the age of 15-17 years. This study aimed to investigate nutritional status and elucidate the associated factors in children aged 15-17 years in the suburban of Vietnam. A cross-sectional study was carried out from November to December 2019 in Vietnam. Total of 424 students aged 15-17 years (153 boys and 271 girls) from Hong Thai Highschool using a randomized sampling method. The nutritional status of studied subjects was determined based on the World Health Organization (WHO) criteria of sex and age specific BMI cut-off points for children between 5 and 19 years old (2007). Rates of overweight and obesity was 8.96%, thinness was 8.02%, there was a statistically significant difference between boys’ and girls’ group (p=0.02). Correlation between BMI and WC, HC showed that WC or HC could be another indicator to determine the nutritional status of children. Having milk or a light meal before going to bed was also found to decrease the risk of being overweight by 66.4% (OR = 0.336, 95% CI: 0.116 – 0.972). Eating as much as possible increases the risk of overweight and obesity 2.2 times (p=0.017). Moreover, fast food consumption and physical activity time were no significant difference between the obesity & overweight and non-overweight groups. Especially, compared with the walking group, the group with adults taken had the risk of overweight and obesity 14 times higher, the group traveling by motorbike had the risk of overweight and obesity 5.056 times higher (with p=0.018 and p=0.04, respectively). The results suggest that there was the DBM for children in suburban, nutrition status was not similar among boys and girls. Public health programs should therefore be developed or improved in order to promote good eating habits and physical activity, especially how to move to school among children in Vietnam.
INTRODUCTION
The childhood nutritional status in the world is currently a prominent issue. In particular, overweight and obesity in children have been a top concern in all areas of the world, not only in high-income countries but also in low-income and middle-income countries [1-3]. The rates of overweight and obesity in developing countries (28.8% overweight, 2.3% obesity) [4] have been similar to high-income countries [5]. In addition to the burden of obesity, the burden of thinness was also popular, creates DBM, especially in developing countries [6, 7]. Southeast Asian Nutrition Survey (SEANUTS) of four countries (Indonesia, Malaysia, Thailand and Vietnam) in 2013 showed that the DBM was differences between four countries [8-12]. In Indonesia, malnutrition was a serious problem with the highest thinness rate among the four countries (39.2% in rural areas and 25.1% in urban areas) [9]. In terms of overweight in urban areas, Vietnam has the highest rate (29%) [12], other side, the highest proportion of rural obesity children in Malaysia (18.1%) [10].
In Vietnam many years ago, economic reform and poverty reduction (Doi moi) have been implemented. The reform has partly improved the health and nutritional status of Vietnamese people [13]. According to the National Institute of Nutrition statistics in 2018, the prevalence of thinness in Vietnam has reduced from 43% in 2000 to 25% in 2015. However, Vietnam still ranks thirty-six in the world for thinness [13, 14]. Recently, overweight, obesity and nutritionally-related chronic diseases (NRCD) have increased rapidly in Vietnam, mainly in the two big cities of Hanoi and Ho Chi Minh City [12]. Now, Vietnam has to face a DBM [13]. It has posed enormous challenges for policy on the nutrition of Vietnam in the coming period.
Moreover, Vietnam was not much research on nutrition status in children. Most of them have shown that overweight, obesity and thinness have increased and there are differences between rural and urban areas, but was not research on associated factors to the nutritional status [12-14]. A few studies have shown associated factors, for example a study on thinness of children from 0.5 to 15 years old in Ho Chi Minh City in 2019, it showed that the rate of obesity, overweight and thinness were respectively 9.8%, 8.4% and 25.8%. That study also found that thinness in children was significantly associated with breastfeeding during the first hour and obesity was associated with starting complementary foods from equal to/more than 6 months [15]. A study on the risk of obesity in 2017 indicates that birth weight and body mass index of the parents are related to obesity, prenatal weight in the obesity was significantly higher than the non-obesity [16]. However, the above studies point out the associated factors of prenatal nutrition and postnatal care without mentioning the subjects diet factors and active factors, which is one of the factors that directly affect the weight. Other side, almost studies focused on rural and urban areas, there was no research in the suburban area in Vietnam, it was a complex area and gradually attracts many people to live. The majority of studies focused on children under 5 years old or primary and secondary school students, there has been no study to evaluate the nutritional status of high school students (15-17 years old) in Vietnam.
From the aforementioned limitation, we conduct research with the aim of evaluating nutritional status and associated factors in children aged 15-17 years in the suburban in Vietnam. Desiring to give an overview and necessary information about the nutritional status of children aged 15-17, thereby contributing to the development of a policy to eliminate the DBM in Vietnam.
METHODS AND MATERIALS
Study populations
A cross-sectional study was carried out from November to December 2019 Vietnam. We enrolled a total of 424 students (153 boys and 271 girls) using a randomized sampling method from Hong Thai High school in Dan Phuong district, a suburb near Hanoi. Participants’ mean age was 16 years 4 months (ranging from 15 years 11 months to 17 years 11 months), without any significant difference between boys and girls. Pupils who suffered from chronic diseases such as mental disorders, cardiac or metabolic disease related to obesity were not involved in this study.
Measurement
Anthropometric indices of all studied subjects, consisted of body weight, height, waist circumference (WC), and hip circumference (HC), were measured twice and then the mean was computed to use in later analysis. Both participants’ weight and height were measured in the morning when they were standing upright, wearing light clothes without shoes or hats. Figures for weight and height were recorded to the closest 0.5 kg and 1 cm, respectively. Waist circumference was determined by placing a tape measure around the bare stomach, at the middle of the iliac crest and the lower rib margin, while hip was defined as the widest part below the waist. This measurement was separately performed for boys and girls in closed rooms to assure their privacy.
Participants were asked to fill in a self-administrated questionnaire, which consisted of 2 parts. In part A, besides socio-demographic information, students were required to answer a variety of questions such as yes/no questions about their food hobby or estimate their amount of time spent on physical activities. Meanwhile, part B mostly focused on students’ frequency of eating, each question was designed as a 5-point scale, ranging from “Never” (1 point) to “Always” (5 points). Questions in which higher points related to eating more than normal were categorized into “eating more” group, while the remains were “eating less” questions. All participants were fully explained about the aim of this study as well as how to answer the questionnaire properly.
BMI calculation and classification of nutritional statues
Body Mass Index (BMI) is a value evaluating body fat based on the weight and height of a person. BMI is calculated as the body weight in kilograms divided by the square of the body height in meter (. The nutritional status of studied subjects was determined based on the World Health Organization (WHO) criteria of sex- and age- specific BMI cut-off points for children between 5 and 19 years old (2007). According to WHO, subjects were classified into 5 different groups: severe thinness, thinness, normal, overweight, and obesity.
Statistical analysis
SPSS version 20.0 (SPSS Inc., Chicago, Illinois) and GraphPad Prism version 8.0 were used to performed analysis. Data in descriptive statistics were expressed as N or Median (interquartile range). The Student’s t-test, nonparametric Mann–Whitney U test, or Fisher’s exact test was used when appropriate. Univariable logistic regression analysis was also performed to evaluate the odds ratio (OR) of being overweight and obese at 95% significant level. P<0.05 was considered statistically significant.
RESULTS
Characteristics of studied subjects
The anthropometric characteristics of studied subjects were given in Table 1. Of 424 students involved in this study, boys accounted for approximately 36% and there was no difference in age distribution between boy group and girl group. It was obvious that figures for boys in almost all characteristics were considerably higher than for girls and differences were statistically significant, except for hip circumference.
Table 1. Characteristics of studied subjects with male and female groups.
Nutritional status of studied subjects
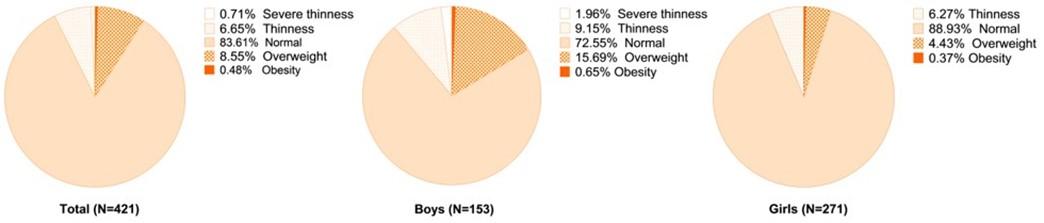
Overall, there were 38 overweight and obese students (accounted for 8.96%), while this figure for thinness and severe thinness was 34 (accounted for 8.02%) (data were not shown). The proportion of obesity and overweight in the boy group was 16.65%, which was considerably higher than in the girl group (only 4.79%). Moreover, the prevalence rate of thinness and severe thinness of boys (1.96% and 9.15%, respectively) were also higher compared with girls (0% and 6.27%, respectively) (Figure 1). Differences were statistically significant.
Association of BMI and other biometric indicators in study subjects
Pearson’s correlation coefficient was estimated to analyze the relation between BMI and other body parameters such as weight, height, or waist circumference. Table 2 indicated that BMI was significantly and positively correlated to weight, waist circumference, and hip circumference with high correlation coefficients, which were 0.852, 0.803, and 0.795, respectively. These results suggested that WC or HC could be another indicator to determine the nutritional status of children. Besides, our analysis also revealed that excess belly fat was accompanied by large hip circumference due to their strong correlation with an r=0.829, p<0.001.
Table 2. Pearson’s correlation analysis for BMI and other biometric parameters in study participants (N=424).
Analysis the association of nutritional status and dietary factors in studied subjects
Univariate logistic regression was performed (Table 3) to assess the association between dietary habits and overweight & obesity in students. Our data showed that students of the non-overweight group liked more kinds of food than those of the overweight & obesity group and the difference was statistically significant (p=0.02). This result indicated that consuming various kinds of food may be a protective factor for childhood obesity. Having milk or a light meal before going to bed was also found to decrease the risk of being overweight by 66.4% (OR = 0.336, 95%; CI: 0.116 – 0.972). Interestingly, no significant associations between the frequency of soft drinks, sweets, and fast-food intake per week as well as the average time spending on main meals and obesity were observed.
When evaluated the eating habits of students in some specific cases through a 5-point scale questionnaire, we found that obesity and overweight group tended to eat more frequently than the remaining group. In addition, if the mean point of questions related to “eating more than usual” rose by 1, the risk of being overweight and obesity increased more than 2.2 times (p=0.017). Similarly, overweight risk reduced by 45.3% if the mean point of “eating less than usual” questions reduced by 1.
Table 3. The association of dietary factors and nutritional status between Obesity & overweight group (N=38) and Non-overweight group (N=386).
Analysis the association of nutritional status and active factors in studied subjects
Data from Table 4 showed that students of the overweight & obesity group and non-overweight group spend the same amount of daily time on physical activities as well as on screen entertainment. In addition, studied participants tended to adopt a sedentary lifestyle while spending much more time (2-3 hours per day) engaging in an activity like playing videogames, watching TV, or using smartphones than doing physical exercises (0.5-1 hour per day). The proportion of students who loved physical activities or played sports after school was not statistically different between the two groups. However, students’ means of transport were found to be highly associated with obese status. Students who were driven to school by parents increased more than 14 times in the risk of being overweight & obese and the odds ratio for those going to school by motorbike was 5.056 compared to those walking to school (with p=0.018 and p=0.04, respectively).
Table 4. The association of active factors and nutritional status between Obesity & overweight group (N=38) and Non-overweight group (N=386).
DISCUSSION
The results showed that the rates of overweight and obesity was 8.96%, thinness was 8.02%, there was a statistically significant difference between boys’ and girls’ group, all proportions of boys group are higher than girls’ group. Correlation between BMI and WC, HC showed that WC or HC could be another indicator to determine the nutritional status of children. Besides, having milk or a light meal before going to bed was also found to decrease the risk of being overweight by 66.4%. Eating as much as possible increases the risk of overweight and obesity 2.2 times. Especially, compared with the walking group, the group with adults taken had the risk of overweight and obesity 14 times higher, the group traveling by motorbike had the risk of overweight and obesity 5.056 times higher.
We found that the nutritional status of children aged 15-17 years in this study was almost different and lower than other study. Example, a research in Norway about obesity status in 2016 showed that the obesity and overweight rate at the age of 15-17 is 20.1%, 2 times higher than this study (8.96%) [17]. In addition, a research in Hanoi, Vietnam in 2019 found that 17.1% were overweight and 19.1% were obesity at the age of 6-11 [18]. Another study in 2010 on 11-14 year old adolescents in Ho Chi Minh City showed the rates of overweight and obesity were 19.6% and 7.9% [19]. The difference can be explained by the scope of our research was suburban, wasn’t represent of the whole country. Scientific evidence has shown that different levels of economic development have different child nutritional status. Specifically, the rate of overweight in urban areas is higher than in rural areas, and the rate of malnutrition in rural areas is higher than in urban areas [12, 20, 21]. On the other side, the rates of overweight and obesity of children in suburban seems to be lower than in urban and larger than in rural, rate of thinness is the opposite. Results of the abbreviated SEANUTS study on under 11 years in Vietnam showed that obesity of children account for 29% in urban, while in rural was 5.6% [12]. Compared to the rate of overweight and obesity in suburban in this study (8.96%), we were found that the rate of overweight in suburban area was in the middle of that in rural and urban. In addition, a statistically significant difference between boys and girls group in this study was similar to other studies, almost studies have shown that boys have rate of overweight and obese higher than girls [22]. Interestingly, this study indicates that boys also have significantly higher rates of thinness than girls, this was the special feature of our research. This was an issue that needs to be considered to help balance the nutritional status of the sexes in the future.
In addition to BMI, WC and HC can be another good indicator to evaluate the nutritional status of children. This was similar to the study in Brazil about children aged 7-10 years, which shows that WC was a good indicator for classifying children’s nutritional status [23]. Two studies in Mexico and China also proved it [22, 24], but no studies have yet to prove that HC is also a reliable indicator for classifying nutrition in children, and this was something new in our study. We believe that having milk or light meal was a protective factor from the risk of obesity and overweight. This can be explained by evidence of nocturnal physiology and digestion of food, in particular, the rate of night and day metabolism was equal, so we also needs more energy while sleeping, it can provide energy, help you sleep well, and keeps the next day from starving [25, 26]. On the other hand, fast food consumption and physical activity time were thought have no significant difference between the overweight and obesity and non-overweight groups. It seems to be unsuitable for reality, but it may be due to cross-sectional study, unable to assess causality. Besides, overweight children may have changed their diet, for example, reducing fast food consumption. This can falsify or hide the association between fast food consumption and obesity. Especially, compared with the walking group, the group with adults taken had the risk of overweight and obesity 14 times higher, the group traveling by motorbike had the risk of overweight and obesity 5.056 times higher. Similar to a cross-sectional study of children in Tanzania 2015, the results indicate that children who walk to school were less likely to be overweight than children using transport [27]. As another example, a 2015 study on active committing to school (ACS) in a US state provided evidence of the rate of overweight in children walking to school compared to cycling lower than 7% [28]. Children’s transportation to school has a profound influence on their risk of being overweight and obesity, this evidence was thought to be very helpful in reducing the rate of overweight and obesity children.
This study has some limitations regarding the generalizability of our findings. First, this study was a cross-sectional study. Therefore, we could not address causal relationships of variables or factors related to nutritional status. The potential causal relationships must be clarified by longitudinal studies. Second, this study only focuses on suburban, the results do not apply to all children in whole country, it was necessary to conduct an extensive study for urban and rural areas to find the difference between each region. In the future, we should conduct more specific study to clarify the associated factors in these findings. Finally, an educational program about daily routines, eating and transportation to school to children and parents was necessary, contributing to reducing the rate of overweight, obesity and thinness based on our study results.
ACKNOWLEDGEMENT
We would like to thank MSc. Phuong Linh Nguyen (Ban Mai School, Hanoi, Vietnam) for critical reading and checking to improve the manuscript. No funding was received in this study.
CONFLICT OF INTEREST
All authors have no conflicts of interest or financial ties to disclose.
AUTHOR CONTRIBUTIONS
DTC, LTD, DTAD, and TNM designed and performed experiments and collected data and informed consents. DTC, VTH, BNL, VTQ, DTT and TNM analysed and interpreted the results, and edited and corrected the manuscript. DTC, VTH, BNL, and VTQ, wrote the manuscript. All authors approved the final manuscript.
References
- [1]Ford ND, Patel SA, Narayan KM. Obesity in Low- and Middle-Income Countries: Burden, Drivers, and Emerging Challenges. Annu Rev Public Health. 2017;38:145-64.
- [2]Jaacks LM, Kavle J, Perry A, Nyaku A. Programming maternal and child overweight and obesity in the context of undernutrition: current evidence and key considerations for low- and middle-income countries. Public Health Nutr. 2017;20:1286-96.
- [3]Williams EP, Mesidor M, Winters K, Dubbert PM, Wyatt SB. Overweight and Obesity: Prevalence, Consequences, and Causes of a Growing Public Health Problem. Curr Obes Rep. 2015;4:363-70.
- [4]Poobalan A, Aucott L. Obesity Among Young Adults in Developing Countries: A Systematic Overview. Curr Obes Rep. 2016;5:2-13.
- [5]Popkin BM, Slining MM. New dynamics in global obesity facing low- and middle-income countries. Obes Rev. 2013;14 Suppl 2:11-20.
- [6]Black RE, Victora CG, Walker SP, Bhutta ZA, Christian P, de Onis M, et al. Maternal and child undernutrition and overweight in low-income and middle-income countries. Lancet. 2013;382:427-51.
- [7]Ng M, Fleming T, Robinson M, Thomson B, Graetz N, Margono C, et al. Global, regional, and national prevalence of overweight and obesity in children and adults during 1980-2013: a systematic analysis for the Global Burden of Disease Study 2013. 2014;384:766-81.
- [8]Schaafsma A, Deurenberg P, Calame W, van den Heuvel EG, van Beusekom C, Hautvast J, et al. Design of the South East Asian Nutrition Survey (SEANUTS): a four-country multistage cluster design study. Br J Nutr. 2013;110 Suppl 3:S2-10.
- [9]Sandjaja S, Budiman B, Harahap H, Ernawati F, Soekatri M, Widodo Y, et al. Food consumption and nutritional and biochemical status of 0.5-12-year-old Indonesian children: the SEANUTS study. Br J Nutr. 2013;110 Suppl 3:S11-20.
- [10]Poh BK, Ng BK, Siti Haslinda MD, Nik Shanita S, Wong JE, Budin SB, et al. Nutritional status and dietary intakes of children aged 6 months to 12 years: findings of the Nutrition Survey of Malaysian Children (SEANUTS Malaysia). Br J Nutr. 2013;110 Suppl 3:S21-35.
- [11]Rojroongwasinkul N, Kijboonchoo K, Wimonpeerapattana W, Purttiponthanee S, Yamborisut U, Boonpraderm A, et al. SEANUTS: the nutritional status and dietary intakes of 0.5-12-year-old Thai children. Br J Nutr. 2013;110 Suppl 3:S36-44.
- [12]Le NBK, Le TH, Nguyen DVA, Tran TN, Nguyen HC, Thanh DT, et al. Double burden of undernutrition and overnutrition in Vietnam in 2011: results of the SEANUTS study in 0.5-11-year-old children. Br J Nutr. 2013;110 Suppl 3:S45-56.
- [13]Khan NC, Khoi HH. Double burden of malnutrition: the Vietnamese perspective. Asia Pac J Clin Nutr. 2008;17 Suppl 1:116-8.
- [14]Khan NC, Le TD, Ngoc TX, Duong PH, Khoi HH. Reduction in childhood malnutrition in Vietnam from 1990 to 2004. Asia Pac J Clin Nutr. 2007;16:274-8.
- [15]Huynh G, Huynh QHN, Nguyen NHT, Do QT, Tran KV. Malnutrition among 6-59-Month-Old Children at District 2 Hospital, Ho Chi Minh City, Vietnam: Prevalence and Associated Factors. Biomed Res Int. 2019;2019:6921312.
- [16]Nguyen HTH, Le TT, Duong DTA, Tao Y, Chu DT. Childhood Obesity Is a High-risk Factor for Hypertriglyceridemia: A Case-control Study in Vietnam. Osong Public Health Res Perspect. 2017;8:138-46.
- [17]Evensen E, Wilsgaard T, Furberg AS, Skeie G. Tracking of overweight and obesity from early childhood to adolescence in a population-based cohort – the Tromso Study, Fit Futures. BMC Pediatr. 2016;16:64.
- [18]Pham TTP, Matsushita Y, Dinh LTK, Do TV, Nguyen TTT, Bui AT, et al. Prevalence and associated factors of overweight and obesity among schoolchildren in Hanoi, Vietnam. BMC Public Health. 2019;19:1478.
- [19]Gerhold DL, Liu F, Jiang G, Li Z, Xu J, Lu M, et al. Gene Expression Profile of Adipocyte Differentiation and Its Regulation by Peroxisome Proliferator-Activated Receptor-γ Agonists. Endocrinology. 2002;143:2106-18.
- [20]Horiuchi Y, Kusama K, Kanha S, Yoshiike N, team Fr. Urban-Rural Differences in Nutritional Status and Dietary Intakes of School-Aged Children in Cambodia. Nutrients. 2018;11.
- [21]Nurwanti E, Hadi H, Chang JS, Chao JC, Paramashanti BA, Gittelsohn J, et al. Rural-Urban Differences in Dietary Behavior and Obesity: Results of the Riskesdas Study in 10-18-Year-Old Indonesian Children and Adolescents. Nutrients. 2019;11.
- [22]Hu L, Huang X, You C, Li J, Hong K, Li P, et al. Prevalence of overweight, obesity, abdominal obesity and obesity-related risk factors in southern China. PLoS One. 2017;12:e0183934.
- [23]Jensen NS, Camargo Tde F, Bergamaschi DP. Body mass index and waist circumference are good indicators for classifying children’s nutritional status. Cien Saude Colet. 2016;21:1175-80.
- [24]Megchun-Hernandez M, Espinosa-Raya J, Garcia-Parra E, Albavera-Hernandez C, Briones Aranda A. Association of anthropometric indicators to evaluate nutritional status and cardiometabolic risk in Mexican teenagers. Nutr Hosp. 2019;36:1049-54.
- [25]Schoffelen PF, Westerterp KR. Intra-individual variability and adaptation of overnight- and sleeping metabolic rate. Physiol Behav. 2008;94:158-63.
- [26]Goldberg GR, Prentice AM, Davies HL, Murgatroyd PR. Overnight and basal metabolic rates in men and women. Eur J Clin Nutr. 1988;42:137-44.
- [27]Mwaikambo SA, Leyna GH, Killewo J, Simba A, Puoane T. Why are primary school children overweight and obese? A cross sectional study undertaken in Kinondoni district, Dar-es-salaam. BMC Public Health. 2015;15:1269.
- [28]Mendoza JA, Liu Y. Active commuting to elementary school and adiposity: an observational study. Child Obes. 2014;10:34-41.