A molecular phylogeny of Taeniophyllum THRJ inferred from DNA barcode regions
Abstract
Taeniophyllum is one of the smallest orchids in the world. This genus has around 210 species listed in the plant list. One type of this orchid is found in the Juanda Forest Park (THRJ) Bandung. This orchid is difficult to identify at the species level due to its limited morphological character and very small size. The taxonomy and conservation status of this plant are unknown; therefore, it can be used as a model for developing DNA barcodes for this genus. In this study, two DNA barcode markers (matK and ITS) were used to reconstruct the phylogenetic relationship of Taeniophyllum THRJ. By using matK sequences, Taeniophyllum THRJ was grouped with Taeniophyllum glandulosum and T. aphyllum. However, using the ITS sequence, Taeniophyllum THRJ was positioned together with Microtatorchis sp., T. smithii, and T. complanatum. The results showed that the matK gene can be used for DNA barcoding of Taeniophyllum orchids. The use of the ITS sequence for the Taeniophyllum group still cannot be confirmed yet. Based on matK sequences and possibly ITS sequences, it can be concluded that Taeniophyllum THRJ is not T. glandulosum but is another species of Taeniophyllum.
INTRODUCTION
As a high source of germplasm, Indonesia has a variety of orchids, starting from the largest orchid (Grammatophyllum speciosum) to the smallest orchid (Taeniophyllum sp.) in the world. Orchid conservation needs to be done considering its active compounds that are potential to be developed as medicines from natural ingredients. The active compounds found in orchids include alkaloids, terpenoids [1-3], and phenols [4]. Approximately 494 soil and epiphytic orchid species, 49 of them were used as traditional medicines in Africa to treat cough, symptoms of diarrhea, treat pain, and worms [5].
Taeniophyllum is one of the genera of the Orchidaceae family (orchids) and consists of about 221 species. This orchid can be found in Indonesia, Malaysia, the Philippines, and several places in China, Japan, Africa, and Australia. This smallest orchid population decreases due to the limited number of host plants. Taeniophyllum can only grow on meranti (Shorea sp.) trees. Meranti trees are woody plants that are often used as materials for building houses and furniture. Also, the host plant is increasingly diminished due to habitat loss caused by several factors including the conversion of land into residential and agricultural areas. This in turn will have an impact on the survival of this orchid.
To overcome the constraints of lack of taxonomists and plant characters, DNA-based identification has been developed. One such method is DNA barcoding. This method has been used for species delineation and analyze species’ genetic diversity [6]. This DNA-based method is increasingly used because it is easier to do, faster, and provides more accurate results than morphological identification [7]. Therefore, this method has been used in the fields of taxonomy, phylogenetics, and biodiversity analysis.
The taxonomists in the world have begun to turn to DNA barcoding technology for the identification of orchids. Several studies of orchid barcoding DNA have been carried out in previous studies [8 – 11]. This technology, besides being used to accurately identify species, can also be used for the reconstruction of phylogenetic trees and to know the kinship between species. The genes used as DNA barcodes for plants are ribulose bisphosphate carboxylase large chain (rbcL), maturase K (matK), intergenic spacers (IGS) such as nuclear ribosomal internal transcribed spacer 1 (nrITS 1) and 2 (nrITS 2), as well as chloroplast IGS which lies between the transfer of RNA for leucine and phenylalanine (cp trnL-trnF IGS) [12]. In DNA barcoding methodology, two standard genes have been approved and recommended by the Barcode of Life (CBoL) Consortium. Both of these genes are rbcL and matK [13]. In various studies, the matK gene was used more frequently than the rbcL gene because the matK gene was even more difficult to apply but provided a higher resolution compared to the rbcL gene [14]. The matK gene is considered to be more accurate in identifying because it can differentiate up to the species level while the rbcL gene can only distinguish up to the genus level [15]. However, the best DNA barcodes for Dendrobium orchids are loci 18S-ITS1-5.8S-ITS2-28S [12]. Given the importance of accuracy in the identification process, then the purpose of this study is to evaluate several DNA barcodes to be used in identifying the smallest orchid in the world, Taeniophyllum THRJ, and its taxonomic implications.
MATERIALS AND METHODS
Sample preparation
The plant was obtained from Juanda Forest Park Bandung, West Java, Indonesia (coordinate 6°51′24″S 107°37′57″E). A sample of 50 mg of orchid roots was crushed in an Eppendorf tube using a mini pestle. DNA extraction was performed using the Plant Genomic DNA Mini Kit (Geneaid Biotech, New Taipei, Taiwan) according to the manual procedure provided. Lysis buffer was added to the tube then incubated for 10 minutes at 65oC to optimize the cell wall lysis process. The lysed cells were then separated by centrifugation for 1 minute at a speed of 5000 rpm, then added with a buffer, and followed by centrifugation for 2 minutes at 10000 rpm. The supernatant was then filtered through the filter column. The total DNA obtained from the centrifugation process was washed from the remains of protein and salt. Furthermore, DNA was eluted for 2-5 minutes and centrifuged for 30 seconds at 10000 rpm.
Amplification of DNA barcode regions
The amplification process was done using MyTaq HS Red Mix (Bioline, Meridian Bioscience, London, UK), which consists of 20 µl, 1.5 µl (10uM) of each primer, 2 µl DNA template, 15 µl MiliQ water. The primer pairs used in this research for amplification and sequencing for each DNA barcode can be seen in Table 1. Amplification condition was as follow: Denaturation at 95°C for 2 minutes, followed by 35 cycles of denaturation at 95°C for 30 seconds, annealing at 50°C for 30 seconds, and polymerization at 72°C for 50 seconds. Final polymerization was done at 72°C for 1 minute [15].
Table 1. Primer pairs used for DNA amplification and sequencing.
Phylogenetic analysis
The phylogenetic analysis was performed using the stepwise procedure developed previously [22]. The chromatograms were processed using Geneious 10.1.3 [23]. The primer sequences were removed by trimming approximately 50 nucleotides at the beginning of DNA sequences. Errors of the reading of the nucleotides were corrected accordingly. Consensus sequences were generated using a pairwise alignment of forward and reverse sequences. All similar sequences obtained from Genebank were aligned using multiple sequence alignment with hierarchical clustering [24], which is available online at http://multalin.toulouse.inra.fr/multalin/, and trimmed accordingly to obtain the core sequence. The history of evolution is concluded using the Maximum Likelihood method based on the Tamura-Nei model [25]. Tree construction was carried out using 1000 x bootstrap by applying Neighbor-Joining and BioNJ algorithms on a pairwise distance matrix estimated using the Maximum Composite Likelihood (MCL) approach. Evolutionary analyses were conducted in MEGA7 [26].
RESULTS
Morphology of Taeniophyllum THRJ
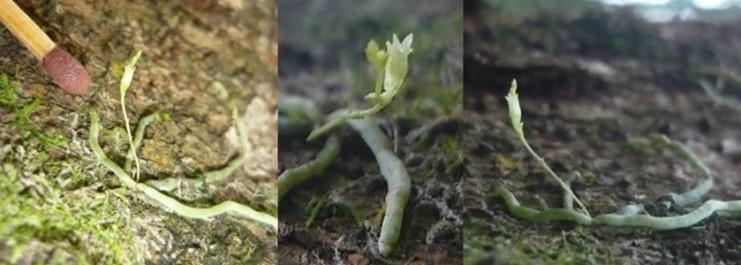
The orchid (Figure 1) has green terete roots, approximately 1 mm in diameters. The flowers were yellowish green with a 2-3 mm long tube of sepals.
Amplification of DNA barcode regions
The regions of DNA barcode which were successfully amplified were only rbcL, matK, and ITS (Figure 2), while the region trnH–psbA failed to be amplified using primer pairs stated in Table 1.
Kimura’s 2-parameter model was used to estimate the genetic distance (Table 2) because it can show base substitution per site between sequences of matK genes. The genetic distance of Taeniophyllum THRJ was 0.039 (3.9%) with T. glandulosum and 0.044 (4.4%) with T. aphyllum. This implies this plant is more closely related to T. glandulosum than T. aphyllum. However, with a genetic distance of 0.033 (3.3%), T. aphyllum is more related to T. glandulosum than Taeniophyllum THRJ. This can assume that Taeniophyllum THRJ is neither T. glandulosum nor T. aphyllum.
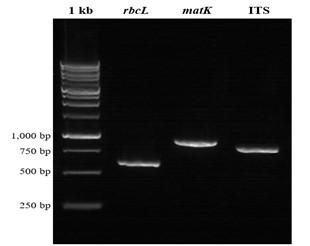
Table 2. The genetic distance of matK gene of Taeniophyllum THRJ with its allied taxa using Kimura’s 2-parameter method.
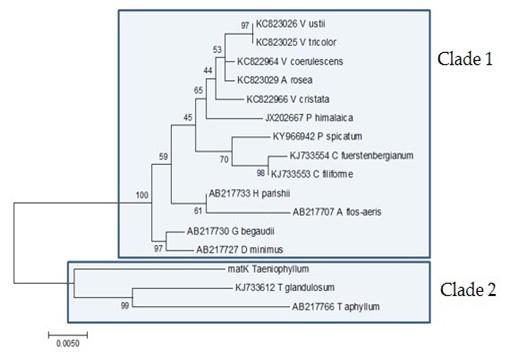
Sequencing results showed that using the matK gene, the Taeniophyllum THRJ has an identity of 96.1% with Taeniophyllum glandulosum voucher Z.J.Liu 5458 (KJ733612.1) [27], and 95.6% with Taeniophyllum aphyllum 5458 (AB217766.1) [28]. The results of phylogenetic tree reconstruction (Figure 3). the Taeniophyllum THRJ is closely related to T. glandulosum and T. aphyllum (clade 2). Both clusters 1 and 2 are from the Aeridinae subtribe.
ssfully amplified. Using rbcL gene for identification, Taeniophyllum THRJ has 98% identity with Drymoanthus adversus voucher CHR:596828 (KT007199.1), Gastrochilus japonicus voucher PDBK2015-1266 (KX871236.1), Gastrochilus calceolaris voucher CPG25086 (KX527436.1), Gastrochilus obliquus voucher CPG25085 (KX527435.1), and Plectorrhiza tridentata FN870901.1.
Identification of the specimen using ITS sequence showed that Taeniophyllum THRJ has an identity of 90% with Microtatorchis sp. (DQ091723.1), 89% with Taeniophyllum smithii (DQ091726.1), Taeniophyllum aphyllum (AB217590.1), Pteroceras pallidum (AB217578.1), and Taeniophyllum complanatum (DQ091724.1). Genetic distance calculation using p-distance for ITS can be seen in Table 3. Taeniophyllum THRJ has a genetic distance of 0.745 with P. pallidum AB217578, 0.738 with P. kunstleri AY912232, 0.731 with Microtatorchis sp. DQ091723, 0.729 with Taeniophyllum smithii, 0.724 with T. aphyllum, 0.715 with T. complanatum, and 0.694 with T. glandulosum. Figure 4 shows phylogenetic tree reconstruction of Taeniophyllum THRJ using ITS sequences. In this tree, Taeniophyllum THRJ is clustered together in clade 2 with Microtatorchis, P. gigantea, T. smithii, and T. complanatum. On the other hand, T. glandulosum and T. aphyllum are clustered in clade 1.
The summary of genetic distance using matK gene (Kimura’s 2-parameter) and ITS (p-distance) is shown in Table 4. Both results agree that Taeniophyllum THRJ is closer to T. glandulosum than T. aphyllum, while T. glandulosum is closer to T. aphyllum than Thaeniophyllum THRJ.
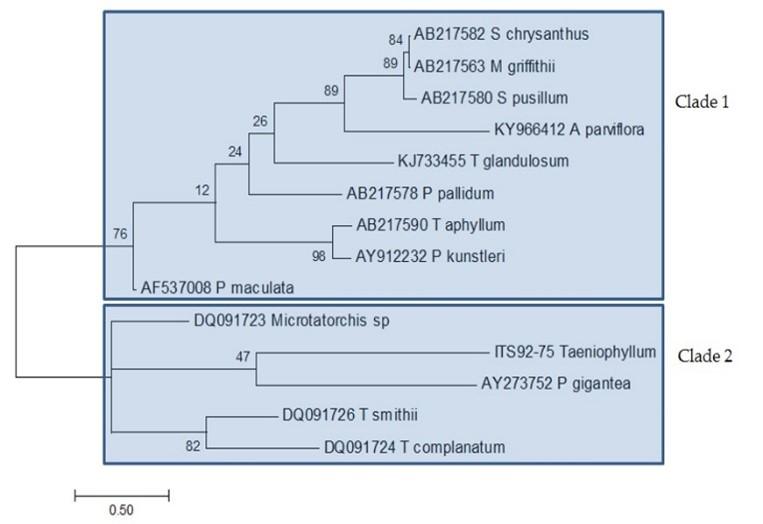
Table 3. The genetic distance of ITS of Taeniophyllum THRJ with its allied taxa using p-distance method.
Table 4. The summary of genetic distance using matK gene and ITS sequences.
DISCUSSION
The two genes, matK and rbcL, are coding genes recommended as DNA barcodes for terrestrial plants [29]. Of them, the matK gene has the most varied regions of the angiosperms plant group. By using matK, it was found that Taeniophyllum THRJ is closely related to T. glandulosum and T. aphyllum. However, estimation of genetic distance using Kimura’s 2-parameter indicates that Taeniophyllum THRJ is not T. glandulosum nor T. aphyllum. This fact is supported by the previous statement that a minimum intraspecific distance of orchid Dendrobium is 0 and maximum is 1.14%, and a minimum interspecific distance is 0 and maximum is 10.1% [9]. For orchid Paphiopedilum, the maximum intraspecific and intraspecific distances were 1.5% and 4.5%, respectively [11]. Because of the genetic distance between Taeniophyllum THRJ with T. glandulosum (3.9%) or with T. aphyllum (4.4%) greater than 1.5%, it is certain that Taeniophyllum THRJ obtained from Tahura Juanda Bandung is not T. glandulosum nor T. aphyllum. An interesting fact is, however, that Taeniophyllum aphyllum Makino is a synonym of Taeniophyllum glandulosum Blume [30]. Using a molecular approach, the genus Microtatorchis (Schltr.) was combined with Taeniophyllum, therefor currently genus Microtatorchis has been renamed as genus Taeniophyllum [31].
Taxa kinship will get closer if it has a small genetic distance value [15]. For example, based on the matK gene, the intraspecific distance is 0.14% for Astragalus (Fabaceae) [32], 0.26% for Acacia (Fabaceae) [33], 0.5% for the family Myristicaceae [34], and 0.16% for Rosaceae [35].
The use of the rbcL sequence did not get the proper identification results. We assume that there no information on the rbcL sequence of Taeniophyllum in GenBank. We also assume that the rbcL gene cannot be used for Taeniophyllum THRJ species identification. A previous study also provided the view that the rbcL sequence cannot be considered as an identification tool for closely related species of Dendrobium [36].
The maximum intraspecific distance of ITS for Dendrobium using p-distance was 0.82 [9], while the genetic distance of Taeniophyllum THRJ and Taeniophyllum glandulosum is 0.694, and T. aphyllum is 0.724. This also reinforces the notion that Taeniophyllum THRJ is not T. glandulosum nor T. aphyllum.
However, due to the large genetic distance using matK and ITS sequences, it can be summarized that Taeniophyllum THRJ is not T. glandulosum nor T. aphyllum. To be assigned a new name, the results must be accompanied by the scrutinization of morphological character. Nevertheless, this finding implies that revisitation of Taeniophyllum taxonomy and reclassification has to be done.
CONCLUSIONS
It can be concluded that the matK gene can be used as a core DNA barcode in the Taeniophyllum group, possibly in combination with the ITS sequence. This finding concludes also that Taeniophyllum THRJ found at Juanda forest park in Bandung is not T. glandulosum nor T. aphyllum.
ACKNOWLEDGEMENT
The authors wish to thank the University of Sam Ratulangi for providing financial support for this research through Riset Dasar Unggulan Universitas Scheme, Fiscal Year 2018.
AUTHOR CONTRIBUTIONS
TET and TBE conceived and design the analysis; LL collected the samples and verified the analytical method; JJP and BJK contributed data analysis; and TET, SM, and TBE wrote the manuscript. All authors discussed the results and contributed to the final manuscript.
CONFLICTS OF INTEREST
There is no conflict of interest among the authors.
References
- [1]Bulpitt CJ, Li Y, Bulpitt PF, Wang J. 2007. The use of orchids in Chinese medicine. J. Royal Soc. Med. 100(12): 558-563.
- [2]Pant B. 2013. Medicinal orchids and their uses: Tissue culture a potential alternative for conservation. African J. Plant Sci.7(10): 448-467.
- [3]Sut S, Maggi F, Dall’Acqua S. 2017. Bioactive secondary metabolites from Orchids (Orchidaceae). Chemistry & Biodiversity 14(11): e1700172.
- [4]Minh TN, Khang DT, Tuyen PT, Minh LT, Anh LH, Quan NV, Ha PTT. Quan NT, Toan NP, Elzaawely AA, Xuan TD. 2016. Phenolic compounds and antioxidant activity of Phalaenopsis Orchid hybrids. Antioxidants 5(31):1-12.
- [5]Chinsamy M, Finnie JF, Van Staden J. 2011. The ethnobotany of South African medicinal orchids. South African J. Botany 77(1): 2-9
- [6]Hubert N, Hanner R. 2015. DNA Barcoding, species delineation and taxonomy: a historical perspective. DNA Barcodes 3: 44-58.
- [7]Kress WJ, Erickson DL. 2008. DNA barcodes: genes, genomics, and bioinformatics. PNAS 105(8):2761-2762.
- [8]Subedi A, Kunwar B, Choi Y. 2013. Collection and trade of wild-harvested orchids in Nepal. J. Ethnobiology and Ethnomedicine 9:64.
- [9]Xu S, Li D, Li J, Xiang X, Huang W. 2015. Evaluation of the DNA Barcodes in Dendrobium (Orchidaceae) from Mainland Asia. PLoS ONE. 10(1): e0115168.
- [10]Kumar R, Mahadani P, Kishore R, Meitei AL, Singh DR. 2016. DNA Barcoding of Indian Orchids. Technical Bulletin 48, National Research Center for Orchids. Astral International, New Delhi.
- [11]Guo Y-Y, Huang L-Q, Liu Z-J, Wang X-Q. 2016. Promise and challenge of DNA barcoding in Venus Slipper (Paphiopedilum). PLoS ONE 11(1): e0146880.
- [12]Pritam C, Goutam B, Nirmalya B. 2017. Distinguishing orchid species by DNA barcoding: Increasing the resolution of population studies in plant biology. OMICS: J Int. Biol. 21(12): 711-720.
- [13]Kress WJ, Erickson DL, Swenson NG, Thompson J, Uriarte M, Zimmerman JK. 2010. Advances in the use of DNA barcodes to build a community phylogeny for tropical trees in a Puerto Rican forest dynamics plot. PLoS ONE 5(11): e15409.
- [14]Hollingsworth PM, Graham SW, Little DP. 2011. Choosing and using a plant DNA barcode. PLoS ONE 6 (5): e 19254.
- [15]Tallei TE, Rembet RE, Pelealu JJ, Kolondam BJ. 2016. Sequence variation and phylogenetic analysis of Sansevieria trifasciata (Asparagaceae). Bioscience Res.13(1): 01-07
- [16]Costion C, Ford A, Cross H, Crayn D, Harrington M, Lowe A. 2011. Plant DNA barcodes can accurately estimate species richness in poorly known floras. PLoS ONE 6(11): e26841.
- [17]Levin RA, Wagner WL, Hoch PC, Nepokroeff M, Pires JC, Zimmer EA, Sytsma KJ. 2003. Family-level relationships of Onagraceae based on chloroplast rbcL and ndhF data. American J Bot. 90: 107–115.
- [18]Kress WJ, Erickson DL, Jones FA, Swenson NG, Perez R, Sanjur O, Bermingham E. 2009. Plant DNA barcodes and a community phylogeny of a tropical forest dynamic plot in Panama. PNAS 106: 18621-18626.
- [19]aldwin BG, Sanderson MJ, Porter JM, Wojcicchowski MF, Campbell CS, Donoghue MJ. 1995. The ITS region of Nuclear Ribosomal DNA: A Valuable Source of Evidence on Angiosperm Phylogeny. Ann. Missouri Bot. Gard. 82: 247-277.
- [20]Tate JA, Simpson BB. 2003. Paraphyly of Tarasa (Malvaceae) and diverse origins of the polyploid species. Systematic Botany 28: 723–737.
- [21]Sang T, Crawford DJ, Stuessy TF. 1997. Chloroplast DNA phylogeny, reticulate evolution, and biogeography of Paeonia (Paeoniaceae). American J. Bot. 84: 1120–1136.
- [22]Tallei TE, Kolondam BJ. 2015. DNA Barcoding of Sangihe Nutmeg (Myristica fragrans) using matK Gene. HAYATI J. Biosciences 22(1): 41-47
- [23]Kearse M, Moir R, Wilson A, Stones-Havas S, Cheung M, Sturrock S, Thierer T, et al. 2012. Geneious basic: An integrated and extendable desktop software platform for the organization and analysis of sequence data. Bioinformatics 28: 1647-1649.
- [24]Corpet F. 1988. Multiple sequence alignment with hierarchical clustering. Nucl. Acids Res. 16(22): 10881-10890.
- [25]amura K, Nei M. 1993. Estimation of the number of nucleotide substitutions in the control region of mitochondrial DNA in humans and chimpanzees. Mol. Biol. Evol. 10(3): 512-26.
- [26]Kumar S, Stecher G, Tamura K. 2016. MEGA7: Molecular evolutionary genetics analysis version 7.0 for bigger datasets. Mol. Biol. Evol. 33: 1870-1874.
- [27]Zou LH, Huang JX, Zhang GQ, Liu ZJ, Zhuang XY. 2015. A molecular phylogeny of Aeridinae (Orchidaceae: Epidendroideae) inferred from multiple nuclear and chloroplast regions. Mol. Phylogen. Evol. 85: 247-254.
- [28]Topik H, Yukawa T, Ito M. 2005. Molecular phylogenetics of subtribe Aeridinae (Orchidaceae): insights from plastid matK and nuclear ribosomal ITS sequences. J. Plant. Res.,118: 271-284
- [29]de Vere N, Rich TC, Trinder SA, Long C. 2015. DNA barcoding for plants. Methods Mol Biol. 1245: 101-118.
- [30]Xinqi C, Wood JJ. 2009. Taeniophyllum Blume, Bijdr. 355. 1825. Flora of China: 25: 444.
- [31]Kocyan A, Schuiteman A. 2014. New combinations in Aeridinae (Orchidaceae). Phytotaxa 161: 61-85.
- [32]Zheng SH, Ren WG, Wan ZH, Huang LF. 2014. Use of chloroplast DNA barcodes to identify Osmunda japonica and its adulterants. Plant Syst. Evol. 301(7): 1843 – 1850.
- [33]Newmaster SG, Ragupathy S. 2009. Testing plant barcoding in a sister species complex of pantropical Acacia (Mimosoideae, Fabaceae). Mol. Ecol. Res. 9 Suppl s1: 172-180
- [34]Newmaster SG, Fazekas AJ, Steeves AD, Janovec J. 2008. Testing candidate plant barcodes regions in the Myristicaceae. Mol. Ecol. Res. 8(3): 480-490.
- [35]Pang X, Song J, Zhu Y, Xu H, Huang L, Chen S. 2010. Applying plant DNA barcodes for Rosaceae species identification. Cladistics 27(2): 165-170.
- [36]Chattopadhyay P, Banerjee G, Banerjee N. 2017. Distinguishing orchid species by DNA barcoding: increasing the resolution of population studies in plant biology. OMICS 21(12):711-720.