Spatial distribution of phytoplankton in Lasolo Bay of Southeast Sulawesi province, Indonesia
Abstract
This study aimed to analyze the distribution of phytoplankton abundance and its relationship with water quality in Lasolo Bay waters. The study was conducted during the West season 2020. The sample consisted of 9 stations located near the mouth of the Lasolo River (station A), coastal waters (station B) and the center part of Lasolo Bay (station C). Phytoplankton sampling was using plankton nets with 25 µm mesh size. Identification of phytoplankton used microscope and the abundance calculation by using Sedgwick Rafter Counting Cell. The results showed that there are 23 phytoplankton genera from 5 classes found, namely 12 genera of Bacillariophycea class, 5 genera of Dinophyceae class, 3 genera of Chlorophyceae class, 2 genera of Cyanophyceae class and 1 genera of Coscinodiscophyceae class. By abundance, phytoplankton compositions of the class Bacillariophyceae predominate with a percentage of 57%. The type of phytoplankton that has the highest abundance is Nitzschia sp. of 2,407 cells/l and the lowest abundance of Amphidium sp. of 1,368 cells/l. Phytoplankton abundance at station A is 41,093 cells/l, station B is 14,234 cells/l and station C is 14,735 cells/l. The distribution of phytoplankton abundance is also influenced by physical and chemical factors such as turbidity, TSS, Nitrate, and Phosphate.
Keywords
INTRODUCTION
Lasolo Bay is one of the waters located in the North Konawe Regency. This area has aquatic resources and life support functions that have been designated as a nature conservation area and serve as a marine nature park [1]. Nickel mining activities are carried out on land and Losolo beach [2]. Mining activities such as dredging, laterite soil extraction, and transportation of minerals are placed along the coast. The entry of mining waste materials through the surface flow in the Lasolo river basin causes pollution in the Lasolo Bay area [3]. Turbid water conditions cause some coral reefs to have been covered with mud. The occurrence of turbidity in the waters causes reduced light penetration in seawater which can affect the growth and development of aquatic organisms. One of the marine organisms that is important for the productivity of a body of water is phytoplankton. Phytoplankton is a major producer that is able to produce energy through the process of photosynthesis [4]. Phytoplankton abundance is one indicator of the quality and productivity of aquatic ecosystems [5]. Distribution of phytoplankton abundance depends on the condition of the aquatic environment.
Changes in water quality can be viewed from the composition and abundance of phytoplankton. Hydrodynamic conditions of an aquatic will affect the distribution pattern of phytoplankton horizontally and vertically. Research on phytoplankton has never been conducted in these waters. Information about the composition and abundance of phytoplankton is essential to determine the productivity of waters
MATERIALS AND METHODS
Sampling locations and procedures
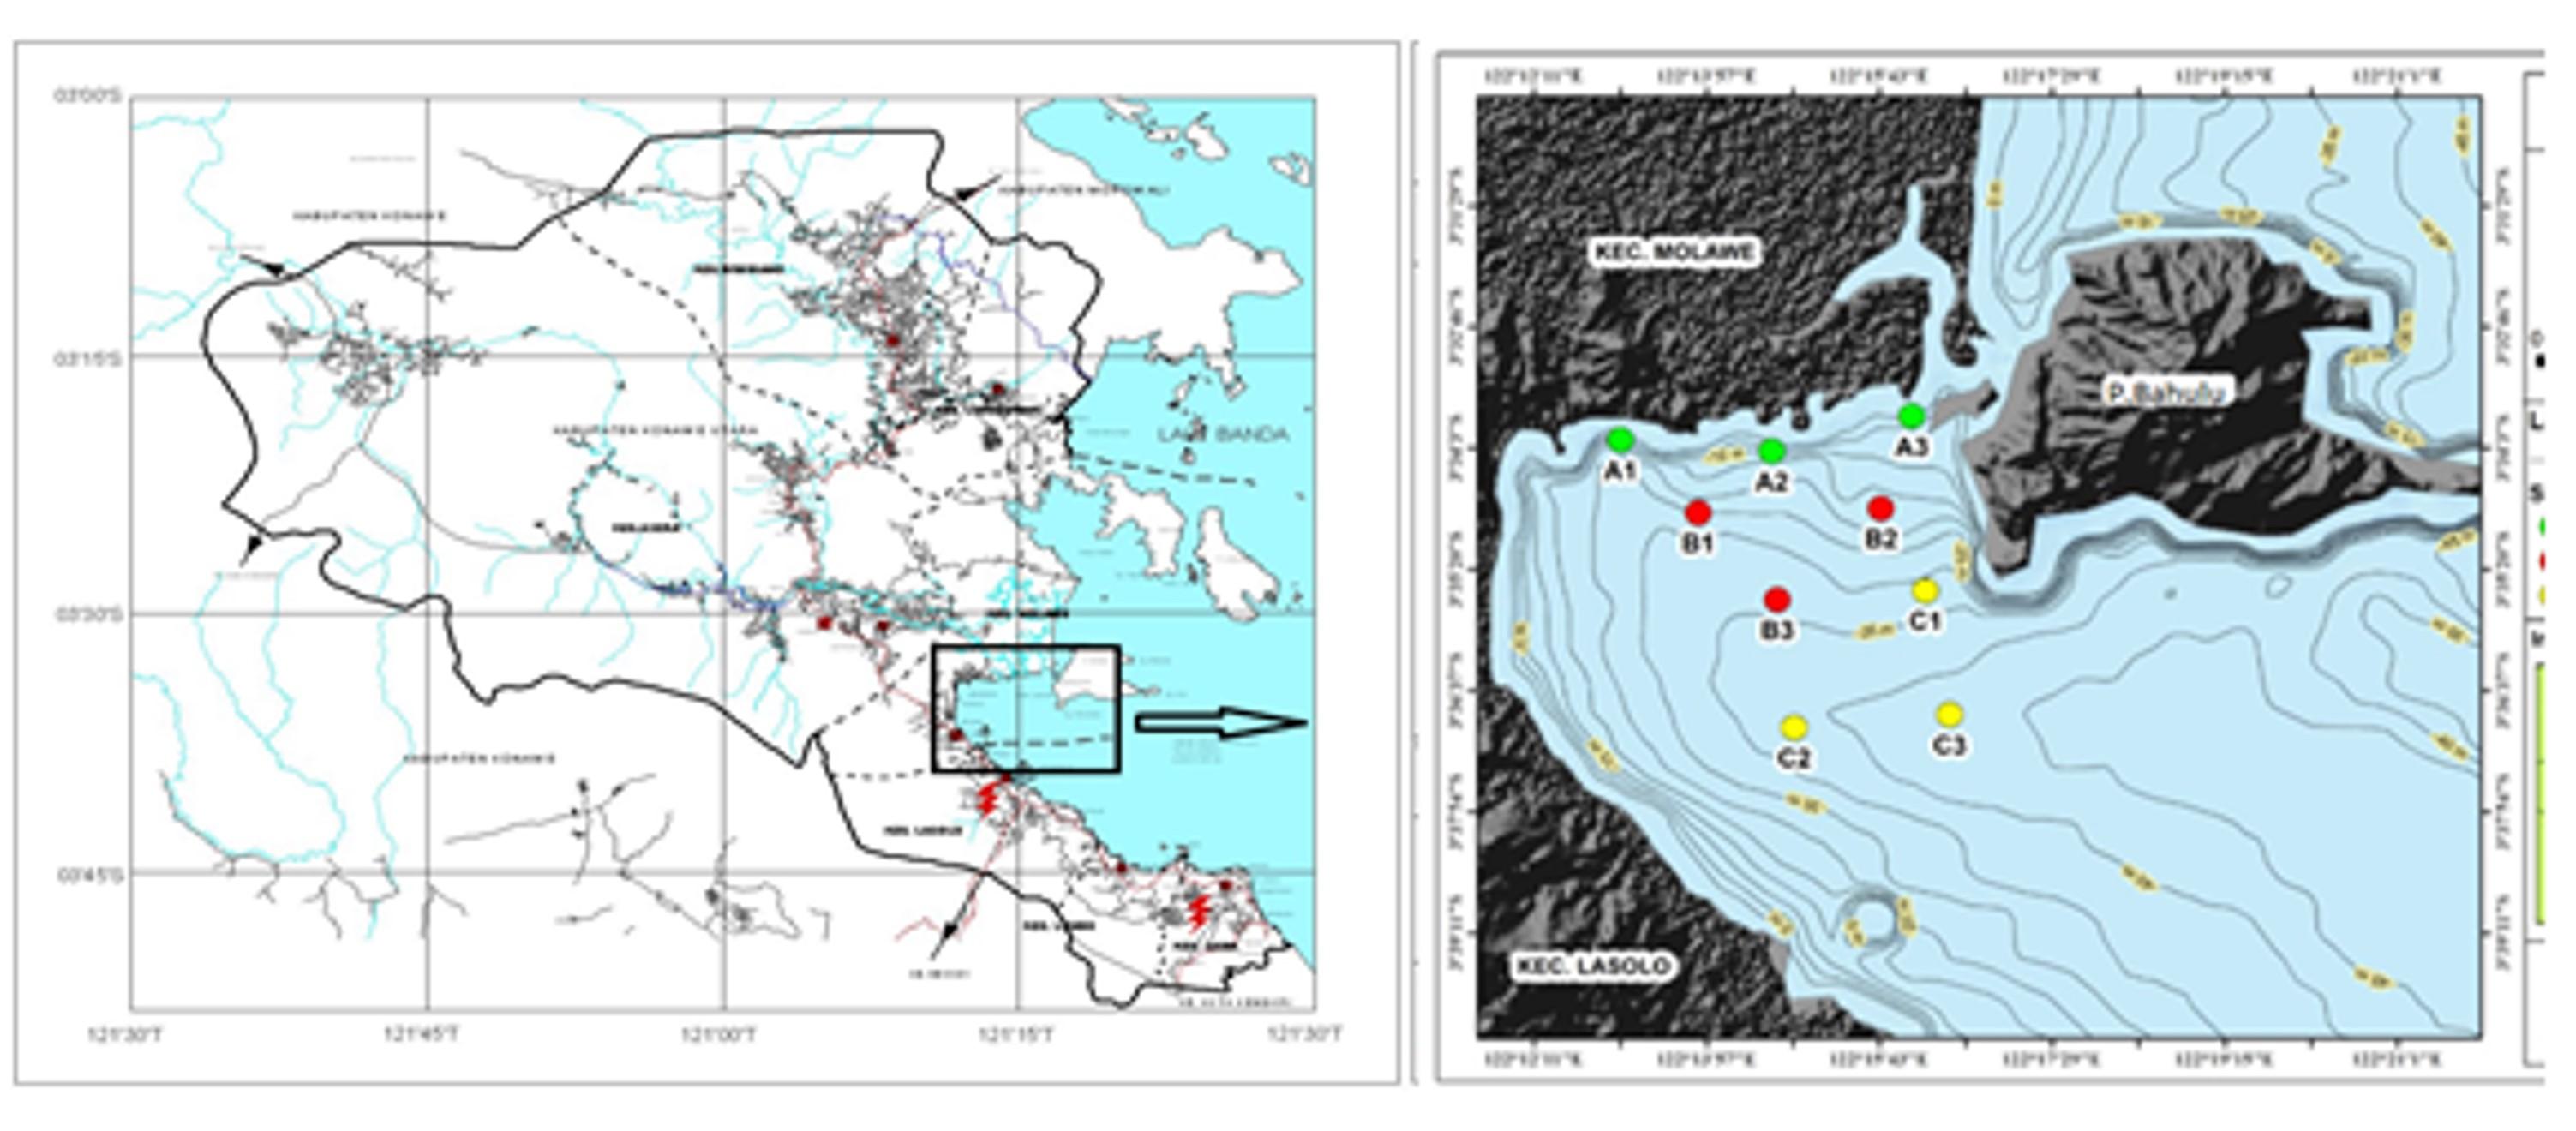
This study was conducted in December 2020 to coincide with the Western monsoon in the waters of Lasolo Bay located at coordinates 122012’00’’ – 122027’00’’BT and 3030’ 00’’ – 3045’00’’LS. Sampling was carried out in 3 zones, zone A is located in front of the mouth of the Lasolo River, zone B is located on the coast, and zone C is located in the middle of Lasolo Bay. Each zone consists of 3 stations, so a total of 9 stations (Figure 1). Vertically, each station is divided into 3 station points based on the depth of sunlight intensity in the water column, namely at a depth of light intensity of 100%, 50%, and 25% of the light intensity of the water surface. Sampling is done horizontally and vertically. Samples collected include the waters’ physical, chemical, and biological parameters (temperature, pH, salinity, brightness, and turbidity). Total Suspended Solid (TSS), Nitrate, Orthophosphate, and phytoplankton abundance were also included. Furthermore, sample collection and measurement were repeated at each station (A, B, and C).
Phytoplankton sampling
Water sampling horizontally using Nansen bottles taken on the surface of the waters and at a depth of sunlight penetration intensity of 50% and 25% from the surface. Determination of the depth of sunlight intensity based on the Beer-Lambert law [6]
Formula………………………………. (1)
Where, Iz = Light intensity at depth z, Io = Light intensity on the surface of the waters, e = Natural logarithm (2.70), k = Dimming coefficient, and z = Depth
Vertical water intake is carried out using a pump connected with a hose to the surface of the water. Furthermore, the sample was filtered using a plankton net with a diameter of 31 cm with a mesh size of 25μm. The sample was stored in a 100 ml vial and preserved using 4% acetic acid lugol. When taking water samples horizontally and vertically, measurements of water chemical physics parameters are also carried out, namely brightness measurements carried out using a secchi disk.
Temperature and salinity measurements use a Hg thermometer (-10 – 110 0C) and a hand fefractometer alcohol ATC. Sea water pH measurement uses a pH meter (Pen type PH-009 I A). Measurement of Nitrates and Phosphates (Orthophosphates) using the standard method of Spectrophotometers. Turbidity is measured in the laboratory based on the Nephelometric method to determine the TSS first, the sample was filtered using filter paper (Whatman) pore size of 0.45 mm, then the sample was analyzed using gravimetric methods.
Phytoplankton analysis
The composition and abundance of phytoplankton were analyzed by the Sedgewick Rafter Counting Cell (SRCC) method using equation [7]; Formula……………………………. (2)
Where N is the abundance of phytoplankton (cells/l), n is the number of cells that are chopped, Vd is the volume of the water sample to be filtered (ml), Vt is the volume of the filtered water sample (ml), and Vcg is the volume of the Sedwick Rafter Cell (ml).
The sample was observed under a microscope (stereo zoom SZX7) with a magnification of 10×40 based on the sweep method, that is, counting all types of plankton present in the volume of the water sample. Phytoplankton is identified using plankton identification manuals. Phytoplankton was identified using the plankton identification manual [8]. The results of the calculations are further analyzed to find out the composition and abundance of phytoplankton.
Statistical analysis
The data obtained were analyzed using Excel data sheets to determine the correlation between phytoplankton abundance and aquatic chemical physics parameters. The data were analyzed using multiple linear regression analysis and F-test. This test was carried out to see the relationship between chemical physics parameters to phytoplankton abundance.
RESULTS
Phytoplankton type composition.
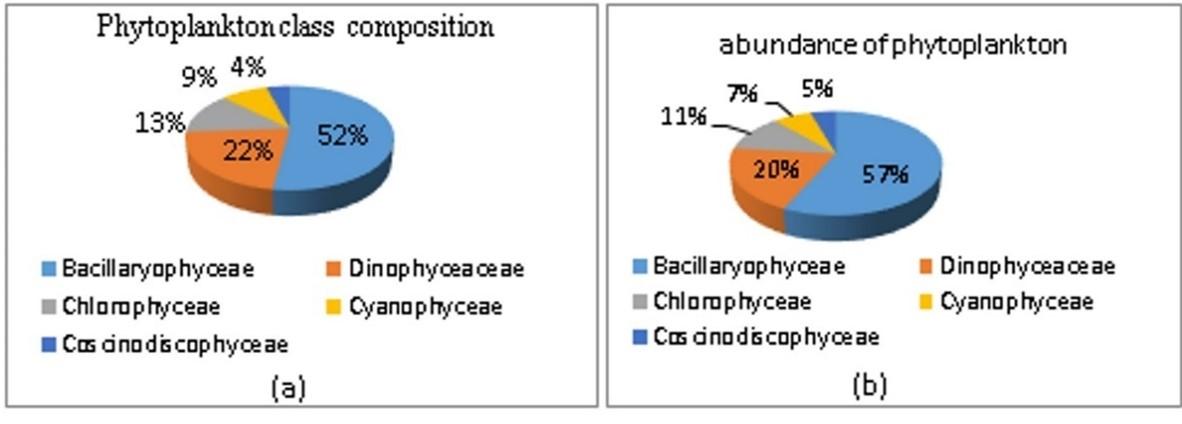
In the Lasolo Bay waters, we found 23 genera of 5 phytoplankton classes consisting of 12 genera the Bacillariophyceae class, 5 genera the Dinophyceae class, 3 genera the Chlorophyceae class, 2 genera the Cyanophyceae class, and 1 genera the Coscinodiscophyceae class (Table 1). The abundance of phytoplankton at station A is greater than that of stations B and C. Types of phytoplankton that have the highest-class composition are Bacillaryophyceae with a percentage of 52%, while the classes Dinophyceae, Chlorophyceae Cyanophyceae and Coscinodiscophyceae are 22%, 13% 9% and 4%, respectively (Figure 2a). The highest abundance was found in the class Bacillaryophyceae of 25,166 cells/l, with a percentage of 57%. Class Coscinodiscophyceae has the lowest abundance of 2,072 cells/l with a portion of 5% (Figure 2b).
Table 1. Abundance of phytoplankton types.
Abundance of phytoplankton
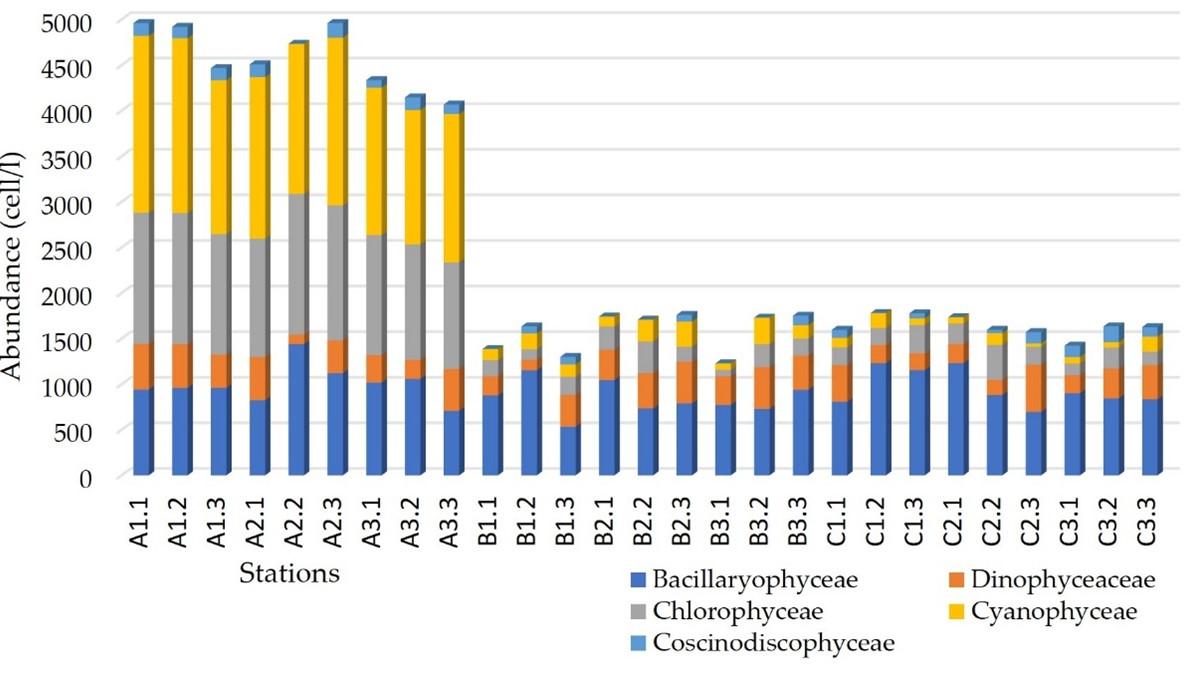
The distribution of phytoplankton abundance varied horizontally and vertically following the depth of sunlight penetration at each station. The highest abundance of phytoplankton between stations in the waters of Lasolo Bay was found at station A at 41,093 cells/l. The phytoplankton abundance at stations B and C was 14,234 cells/l and 14,735 cells/l, respectively. A graph of the abundance of types between stations can be seen in Figure 3. The type of phytoplankton with the highest abundance is found at station A, namely Amphora sp. by 1,117 cells / l, at station B is Microcystus sp. by 1,017 cells/l and station C is Rhizosolenia sp. by 981 cells/l. In contrast, the lowest type of abundance is Peridinium sp. of 313 cells / l (Table 1).
Water physicochemical conditions
The physical and chemical characteristics of Lasolo Bay water are shown in Table 2.
Table 2. Water quality measurement.
DISCUSSION
The composition of phytoplankton by the number of species in the waters of Lasolo Bay is dominated by the class Bacillariophyceae (Diatoms). The class Bacillariophyceae dominates with a percentage of more than 52% because this phytoplankton is able to adapt to the environment and has a high reproductive power [8]. The distribution of phytoplankton with the highest abundance is found at station A with a range of 4,067 – 4,960 cells/l in front of the mouth of the Lasolo river. The average abundance at station A is present on the surface and decreases with increasing depth. The intensity of reduced sunlight (50% and 25%) may cause a lower abundance of phytoplankton [9].
The spatial distribution of the abundance of phytoplankton types varies at each station. The phytoplankton found are scattered almost over the entire surface of the waters, and the depth is suitable for sunlight penetration. Changes in abundance tend to decrease towards the coast towards the central part of the bay [10]. Bacillariophyceae and Cyanophyceae have a higher abundance than other classes found. Some factors that can support the abundance of phytoplankton include the presence of nutrients such as Nitrates and Phosphates [11]. The total abundance of phytoplankton on the surface (0 m) is 14,058 cells/l, at a depth of 0.5-2 m of 15,323 cells/l and a depth of 2 – 5 m of 14,887 cells/l.
Vertically, the highest abundance was found at station A2.2 at a light intensity depth of 50% of the surface intensity or at a depth of 2.8 meters by 2021 cells/l. In comparison, the highest abundance of types is found at stations A1.1 and A2.3 with the most types of phytoplankton being Amphora sp., as many as 1,117 cells/l. The lowest abundance of the type is Merismopedia sp. of 312 cells/l. The Bacillariophyceae class dominates the phytoplankton composition at station B on the coast and has the highest number of types at various depths. The highest abundance at station B3.3 at a depth of 4.3 m is 1,751 cells/l and is dominated by the Cyanophyceae class, namely Microcystus sp., which is 1017 cells/l. At station C, the composition of phytoplankton is also dominated by the class Bacillaryophyceae, a type of Rhizosolenia sp. Further, classes are Dinophyceae (2,577 cells / l), Chlorophyceae (1996 cells/l), Cyanophyceae (873 cells/l), and Coscinodiscophyceae (707 cells/l).
The difference in abundance is due to the influence of activities around the waters and conditions at each station. Each site has a different anthropogenic impact, and nutrient supply also affects the growth of phytoplankton in the waters [12]. High nutrient levels are generally found on parts of the surface that are still affected by freshwater, such as at the mouth of rivers. The nutrient is derived from human activities on land [13]. The higher abundance of phytoplankton at station A (Figure 3) is due to being influenced by nutrients coming from land that enter the waters through streams and surface flows.
Environmental factors also influence the distribution and growth rate of phytoplankton, among others temperature, salinity, turbidity, TSS, and nutrients. River estuaries cause the high abundance at station A with high nutrient levels, namely Phosphate 0.71 mg/l and Nitrate 0.52 mg/l. In addition, low turbidity and TSS also affect the distribution of phytoplankton abundance. Table 2 shows station A located at the mouth of the Lasolo river, has low turbidity and TSS concentration and conversely has a high abundance of phytoplankton. The concentration of TSS at station A was 140 mg/l – 420 mg/l with a higher phytoplankton abundance value of 41,093 cells /l. Stations B and C, have a turbidity value range of 13.5 mg/l – 28.1 mg/l, with the highest TSS value of 570 mg/l and the lowest of 290 mg/l. TSS concentration influences phytoplankton’s abundance; the lower the concentration, the greater the abundance of phytoplankton [14].
Seawater temperature is also critical in metabolic processes and reproductive abilities affecting the composition and abundance of phytoplankton [15]. The temperature range in the waters of Lasolo Bay ranges from 28.7 – 31.8 0C. The highest temperature is at station C3.1, and the lowest is at station A2.1. The temperature distribution shows the value is getting higher towards the middle of the bay because sampling is carried out in different timescales from morning to noon. However, the temperature range during the study was still within the temperature range corresponding to the growth and development of phytoplankton, namely 28-32 0C [16].
The salinity obtained at station A ranges from 2.6 – 30.6 o/oo because the station is located around the mouth of the Lasolo river, which is influenced by freshwater input from the mainland, especially at high tide and low tide. At station B the salinity ranges from 21.6 – 32.6 o/oo, and at station C it ranges from 16.5 – 31 o/oo. Generally, low salinity values are found near the mouth of the Lasolo river. The low salinity value is due to its location adjacent to the mouth of the Lasolo river which is strongly influenced by the tidal activity of the waters.
The correlation between phytoplankton abundance and aquatic chemical physics parameters is based on correlation tests with a value of 0.743 and an F significance value of 0.016. These values indicate a strong correlation between phytoplankton abundance and water quality parameters. These physical and chemical factors cause the distribution of phytoplankton to be uneven so that they have varying abundances [17]. Phytoplankton abundance values found at station A amounted to 41,093 cells/l, station B was 14,234 cells/l, and station C was 14,735 cells/l.
CONCLUSION
In the Lasolo Bay waters found 23 genera of 5 phytoplankton classes consisting of 12 genera the Bacillariophyceae class, 5 genera the Dinophyceae class, 3 genera the Chlorophyceae class, 2 genera the Cyanophyceae class and 1 genus the Coscinodiscophyceae class. The highest abundance of phytoplankton was found at station A at 41,093 cells/l. and the lowest abundance was at station B of 14,234 cells/l. Based on the depth of the sunlight intensity entering the waters, the distribution of phytoplankton abundance with an intensity of 100%, 50% and 25% of the surface intensity was 14,058 cells/l, 15,323 cells/l, and 14,887 cells/l. The type of phytoplankton that has the highest abundance is Nitzschia sp. of 2,407 cells/l and the lowest abundance of Amphidium sp. of 1,368 cells/l. The distribution of the abundance of phytoplankton is also influenced by the physical and chemical factors of the waters, namely turbidity, TSS, Nitrate, and Phosphate. The correlation between the abundance of phytoplankton with the physical parameters of aquatic chemistry based on a correlation test with a value of 0.743 and the significance value of 0.016 shows a strong correlation.
ACKNOWLEDGEMENTS
Thanks to Prof. Ir. H. La Sara, Ph.D., Dr. Muliddin and Prof. Dr. Asriyana, S.Pi.,M.Si for his guidance and direction in completing this research. I would also like to thank the Biology Laboratory of Halu Oleo University for its assistance in facilitating and analyzing water quality data.
AUTHORS CONTRIBUTION
Irawati; Develop and design experiments, equipment, prepare materials, sample data, and analyze data. La Sara, Muliddin, Asriyana; designing experiments, guiding drafting manuscripts, correcting manuscripts, and providing technical input.
CONFLICTS OF INTEREST
There is no conflict of interest among the authors.
References
- [1]Kusmanto E, Surinati D. Stratifikasi massa air di Teluk Lasolo , Sulawesi Tenggara, Oseanologi dan Limnol. di Indonesia. 2016; 1(2): 17–29.
- [2]Ahmad F, “Dampak aktivitas perkotaan dan penambangan Nikel terhadap tingkat kontaminasi logam berat dalam air laut dan sedimen,” Indonesia. J. Mar. Sci. 2013; 18 (2): 71–78.
- [3]Setyawan WB, “Muatan sedimen tersuspensi dan kualitas lingkungan perairan Kendari, Sulawesi Tenggara,” 2016; 4: 495–501.
- [4]I. M. S. and Rissik D, Plankton. Australia: CSIRO , 2009.
- [5]Sahami FM, Baruadi ASR and Hamzah SN, “Proceeding the 1st International Seminar on sustainability in the marine fisheries sector 2017,” in Study of Phytoplankton Abundance for the Development of Pearl Oyster Culture Area in the North Gorontalo Waters, 2017; 1–7.
- [6]Asriyana and Yuliana, Produktivitas Perairan, Edisi revisi. Kendari: PT Bumi Aksara, 2019.
- [7]APHA, Standard Methods for the Examination of Water and Wastewater, 2nd ed. Washington DC: American Public Health Association/American Water Works Association/Water Environment Federation, 2005.
- [8]Odum EP, Ecology, Edisi 3. Yogyakarta: Gadjah Mada University Press Yogyakarta, 1993.
- [9]Muhtadi A, “Produktivitas Primer Perairan,” Researchgate.Net, 2017; 14(1): 1–19.
- [10]Ryabushko LI, Lishaev DN and Kovrigina NP, “Species diversity of epilithon diatoms and the quality of the waters of the Donuzlav gulf ecosystem (Crimea, the Black sea),” Diversity, 2019; 11( 7).
- [11]Aminah S, Nuraini RA, and Djunaedi A, “Komposisi dan kelimpahan fitoplankton di perairan Pandansari, Desa Kaliwlingi, Kabupaten Brebes, Jawa Tengah,” J. Mar. Res., 2020; 9(1): 81–86.
- [12]Wang X, Sun J and Yu H, “Distribution and environmental impact factors of phytoplankton in the Bay of Bengal during autumn,” Diversity, 2022; 14(5): 1–12.
- [13]Simanjuntak M, “Hubungan Faktor Lingkungan Kimia, Fisika terhadap Distribusi Plankton di Perairan Belitung Timur, Bangka Belitung,” J. Perikan., 2009; 11(1); 31–45.
- [14]Edje BO, Ishaque AB, and Chigbu P, “Spatial and temporal patterns of d13C and d15N of suspended particulate organic matter in Maryland Coastal Bays, USA,” Water (Switzerland), 2020; 12(9): 1–21.
- [15]Lo WT, Hsu PK, Fang TH, Hu JH, and Hsieh HY, “Phytoplankton Communities impacted by thermal effluents off two coastal nuclear power plants in subtropical areas of northern Taiwan,” Terr. Atmos. Ocean. Sci., 2016; 27(1): 107–120.
- [16]Hidup MNL, “Salinan Keputusan Menteri Negara Lingkungan Hidup Nomor: 51 Tahun 2004 Tentang Baku Mutu Air Laut,”. April, Jakarta:, 2004; (1–5).
- [17]Wulandari DY, Pratiwi NTM, and Adiwilaga EM , “Distribusi Spasial Fitoplankton di Perairan Pesisir Tangerang ( Spatial Distribution of Phytoplankton in the Coast of Tangerang ),” Ilmu Pertan. Indonesia., 2014; 19(3): 156–162.