Codon usage bias and purifying selection identified in Cirrhinus reba mitogenome
Abstract
In our previous study, we described sequence assembly and organization of the complete mitochondrial genome of a threatened labeonine fish, Cirrhinus reba (GenBank accession no.: MN862482). In this study, our attempts were to find out any mutation or selection pressures and codon usage patterns existing in the mitogenome of the same fish. We applied bioinformatics tools to measure important gene parameters including AT/GC skewness, codon adaptation index (CAI), the effective number of codons (ENc) and GC percentages of each protein coding gene. We found an overrepresentation of A and C resulting a lower number of T and G bases, respectively, where AT-skew was slightly positive, and GC-skew was slightly negative. Except for ND6, all protein coding genes (PCGs) had negative GC-skew, which indicated the higher occurrence of Cs. Based on comparative selective strength analysis with the PCGs of two related mitogenomes, we revealed that most of the PCGs (except for ND1, COX2 and ND5 genes) retained the dN/dS or Ka/Ks values less than 0.1 implying that they evolved under strong purifying selection. We further analyzed the codon frequency and relative synonymous codon usage (RSCU) and observed a total of 3802 codons which were used for coding 20 amino acids by a standard set of 64 codons. The amino acids Leucine and Serine were encoded each by six different codons, whereas rest of the amino acids was encoded by either two or four codons. We identified a total of 25 RSCU values (> 1) and revealed 12 codons as “overpresented” that implied for codon usage bias to engage in highly expressed genes for efficient protein synthesis via translational selection. The existence of codon usage biasness rolling in translational selection and the signs of purifying selection identified in PCGs suggest obvious conservation of this threatened fish species.
Keywords
INTRODUCTION
Mutation rate is high in mitochondrial genomes because of the free radicals which are generated by the respiration inside the mitochondria and remain very close proximity to the mitochondrial DNA. Consequently, mitochondrial genes experience much higher and faster evolution rates than nuclear genes. In the mitogenomes of different species, mutation pressure creates variation in the frequencies of the nucleotide bases at both synonymous and nonsynonymous sites [1-2]. Due to the asymmetric type of replication of two strands of mitochondrial genome, the mutation rates are not equal which means that the frequencies of G and C are not same, and the frequencies of A and U are also different [1-3].
Although mitochondrial gene order and composition are highly conserved, nucleotide sequences show rapid divergence [4]. The famous population geneticist, Motoo Kimura postulated the neutral theory of molecular evolution, claiming that in most instances where a genetic change spreads across a population caused by genetic drift acting on neutral mutations [5]. However, the change is not necessarily reflected in phenotypic change [5]. In case of natural selection, selective removal of deleterious alleles occurs via negative selection or purifying selection [6]. Purging by genetic drift can remove primarily deeply recessive alleles (may be deleterious or beneficial), whereas natural selection can remove any type of deleterious alleles [7]. In small population, fixation of any selection pressures occurs promptly in fewer generations than that in large random mating populations. In strong purifying or negative selection on a locus, the purging of deleterious variants result in the incidental removal of linked variation. This occasional purging of non-deleterious alleles adjacent to deleterious ones is called background selection which may produce decreased level of variation surrounding the locus under selection [8].
Due to degeneracy of genetic code, preference of codon usage determines the functional expression of a protein in an organism. The patterns of codon usage vary in different protein coding genes of a mitochondrial genome. Mutation pressure is dominant in determining codon usage patterns in mitochondrial genes that can be influenced by translational selection [1]. Additional factors including compositional constraint of nucleotides, interaction between codon and anticodon, conservation of amino acids, etc., might drive the codon frequency, codon usage biasness in the genome of an organism [9].
A plethora of manmade and natural causes have imposed a significant and alarming threat to the existence of various fish species in Bangladesh including Cirrhinus reba. The C. reba is a freshwater labeonine fish which is categorized as a near threatened (NT) species in Bangladesh [10-11]. In the present study, base composition and skewness, various gene parameters, codon frequency and relative synonymous codon usage (RSCU), selection pressure and mutation rate have been analyzed for the protein coding genes of mitochondrial genome of the threatened labeonine fish, C. reba to provide valuable information on codon usage patterns and mutation pressure prevailing on the fish species.
MATERIALS AND METHODS
Base composition and skewness analysis
Base composition of the complete mitochondrial genome of C. reba was analyzed by retrieving NCBI accession, MN862482 [11]. The skewness [12] of the base composition of any DNA sequences was measured by using the formula where the relative number of As is to Ts (AT skew = [A – T]/[A + T]) and the relative number of Gs is to Cs (GC skew = [G – C]/[G + C]). Skewness due to any particular nucleotides is attributed to differential mutational pressures originated from the asymmetric replication of mtDNA [13]. CAIcal is a web server, freely available at http://genomes.urv.es/CAIcal, which was used to estimate important computational gene parameters. Some of the gene parameters are codon adaptation index (CAI) [14], the effective number of codon (ENc) [15] or G plus C percentage. Measurement of codon adaption index (CAI) is commonly applied to estimate codon usage bias in gene expression [14]. CAI values range from 0 to 1, where higher values indicate a higher percentage of the most available codons.
Effective number of codon (ENc)
The ‘effective number of codon’ [15-16] was estimated to identify the independent synonymous codon bias found in the genes of a genome. It indicates to what extent all 61 codons are engaged to express a gene. Expressivity of a gene depends on the efficient execution of codon usage [17], for instance, most available codons and codons interacting to abundant tRNA species in the cells are preferred in case of highly expressed genes [18]. Approaching the effective number of codons toward 20 imply that the respective gene is biased with its codons, while an unbiased gene approaches toward 61.
Codon usage and RSCU analysis
The codon usage frequency was estimated by using MEGA7 [19] and relative synonymous codon usage values (RSCU) were determined by using the formula described by Sharp et al. [20]. The RSCU value of a codon is the ratio of the observed occurrences of a codon to that of the expected usage frequency under the assumption that all synonymous codons for a particular amino acid participate equally [20; 21]. When all the synonymous codons of an amino acid participate without any preferences, the RSCU value of each codon equals to one. The codons with RSCU values >1.6, are considered to be “overrepresented” whereas the codons with RSCU values <0.6, are considered to be “underrepresented” [21; 22].
Selection pressure and mutation rate analysis
For exploring the mechanisms of DNA sequence evolution of protein-coding genes, a powerful computational tool is applied to estimate nonsynonymous (substitutions that replace an amino acid by another) and synonymous (silent) substitution rates in the coding sequences, termed as Ka and Ks, or dN and dS, respectively [23]. Ka or dN reflects nonsynonymous substitutions per nonsynonymous site, and Ks or dS reflect synonymous substitutions per synonymous site. However, the Ka/Ks ratio (or ω, dN/dS) is frequently used as an estimator of selective strength for the evolution of DNA sequence, with ω > 1 implying adaptive (positive) selection, ω < 1 implying purifying (negative) or conservation selection, and ω close to 1 implying neutral mutation. In this study, dN/dS ratios were calculated by using an online based Synonymous Non-synonymous Analysis Program (SNAP v2.1.1) (www.hiv.lanl.gov) [24] where sequences of the protein coding genes were uploaded after being aligned by ClustalW.
RESULTS
Base composition and AT-/GC-skewness
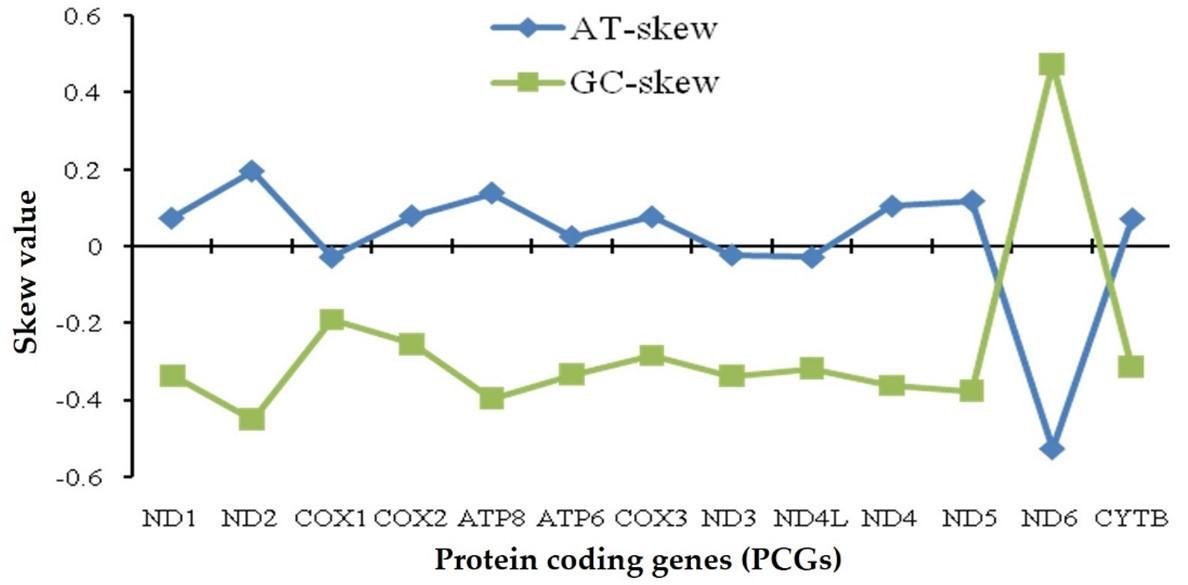
Based on the base composition of complete mitogenome of C. reba, the AT-/GC-skews analysis showed an overrepresentation of A and C resulting a lower number of T and G bases, respectively, where AT-skew was slightly positive (0.116) and GC-skew was slightly negative (-0.261) (Figure 1). Except for ND6, all protein coding genes (PCGs) showed negative GC-skew, that indicated the higher occurrence of Cs. On the other hand, the COX1, ND3 and ND4L had slightly negative AT-skew (-0.03) and the ND6 had a negative AT-skewness of -0.528, meaning that the higher occurrence of Ts over As.
Gene parameters
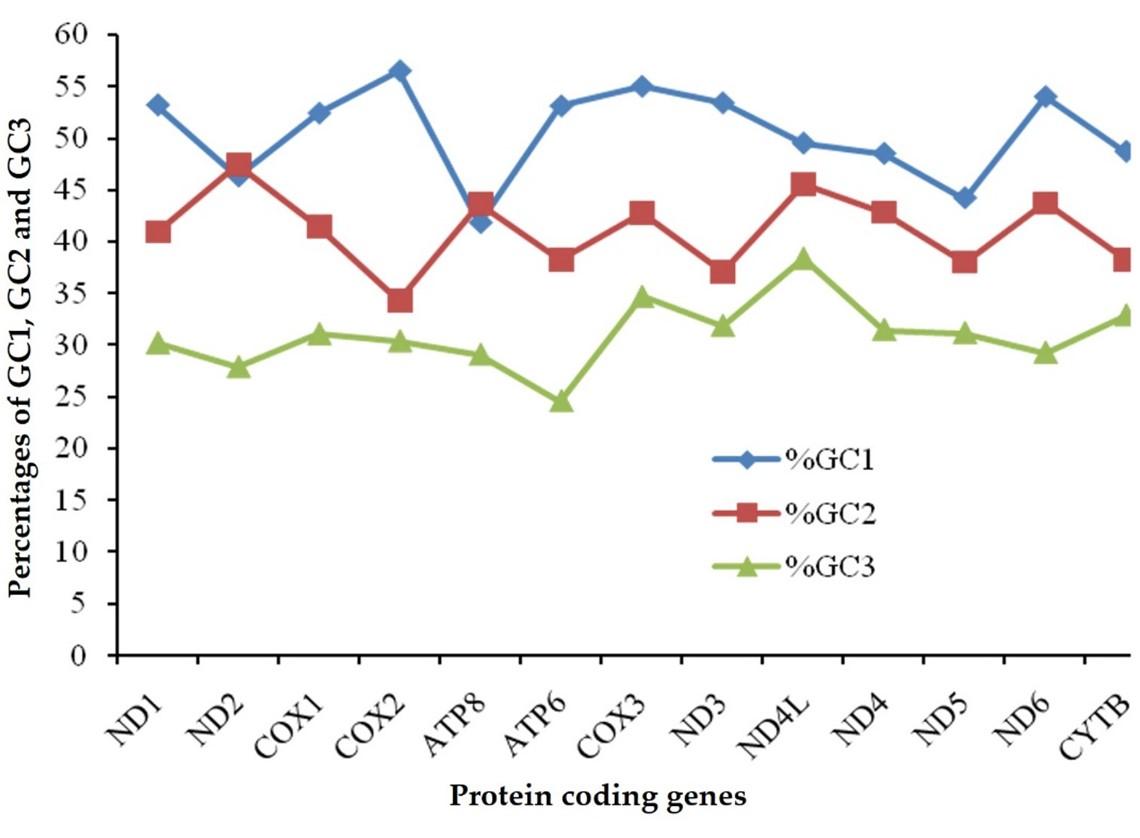
Codon adaption index (CAI) of the protein coding genes of the studied fish ranged from 0.56 to 0.641 implied that they experienced an average codon usage bias to be used in gene expression (Table 1). Effective number of codon (ENc) varied from 32.2 to 41.8, where ND1 (32.8), ATP8 (33.1) and CYTB (32.2) possessed the ENc values lower than 35 (Table 1). Percentage of GC bases at the 1st, 2nd, 3rd position of codons were shown in Figure 2, where % GC3 was lower than % GC1 and % GC2 across all the PCGs.
Table 1. Gene parameters for 13 protein coding genes (PCGs) of the mitogenome of C. reba.
Codon usage patterns
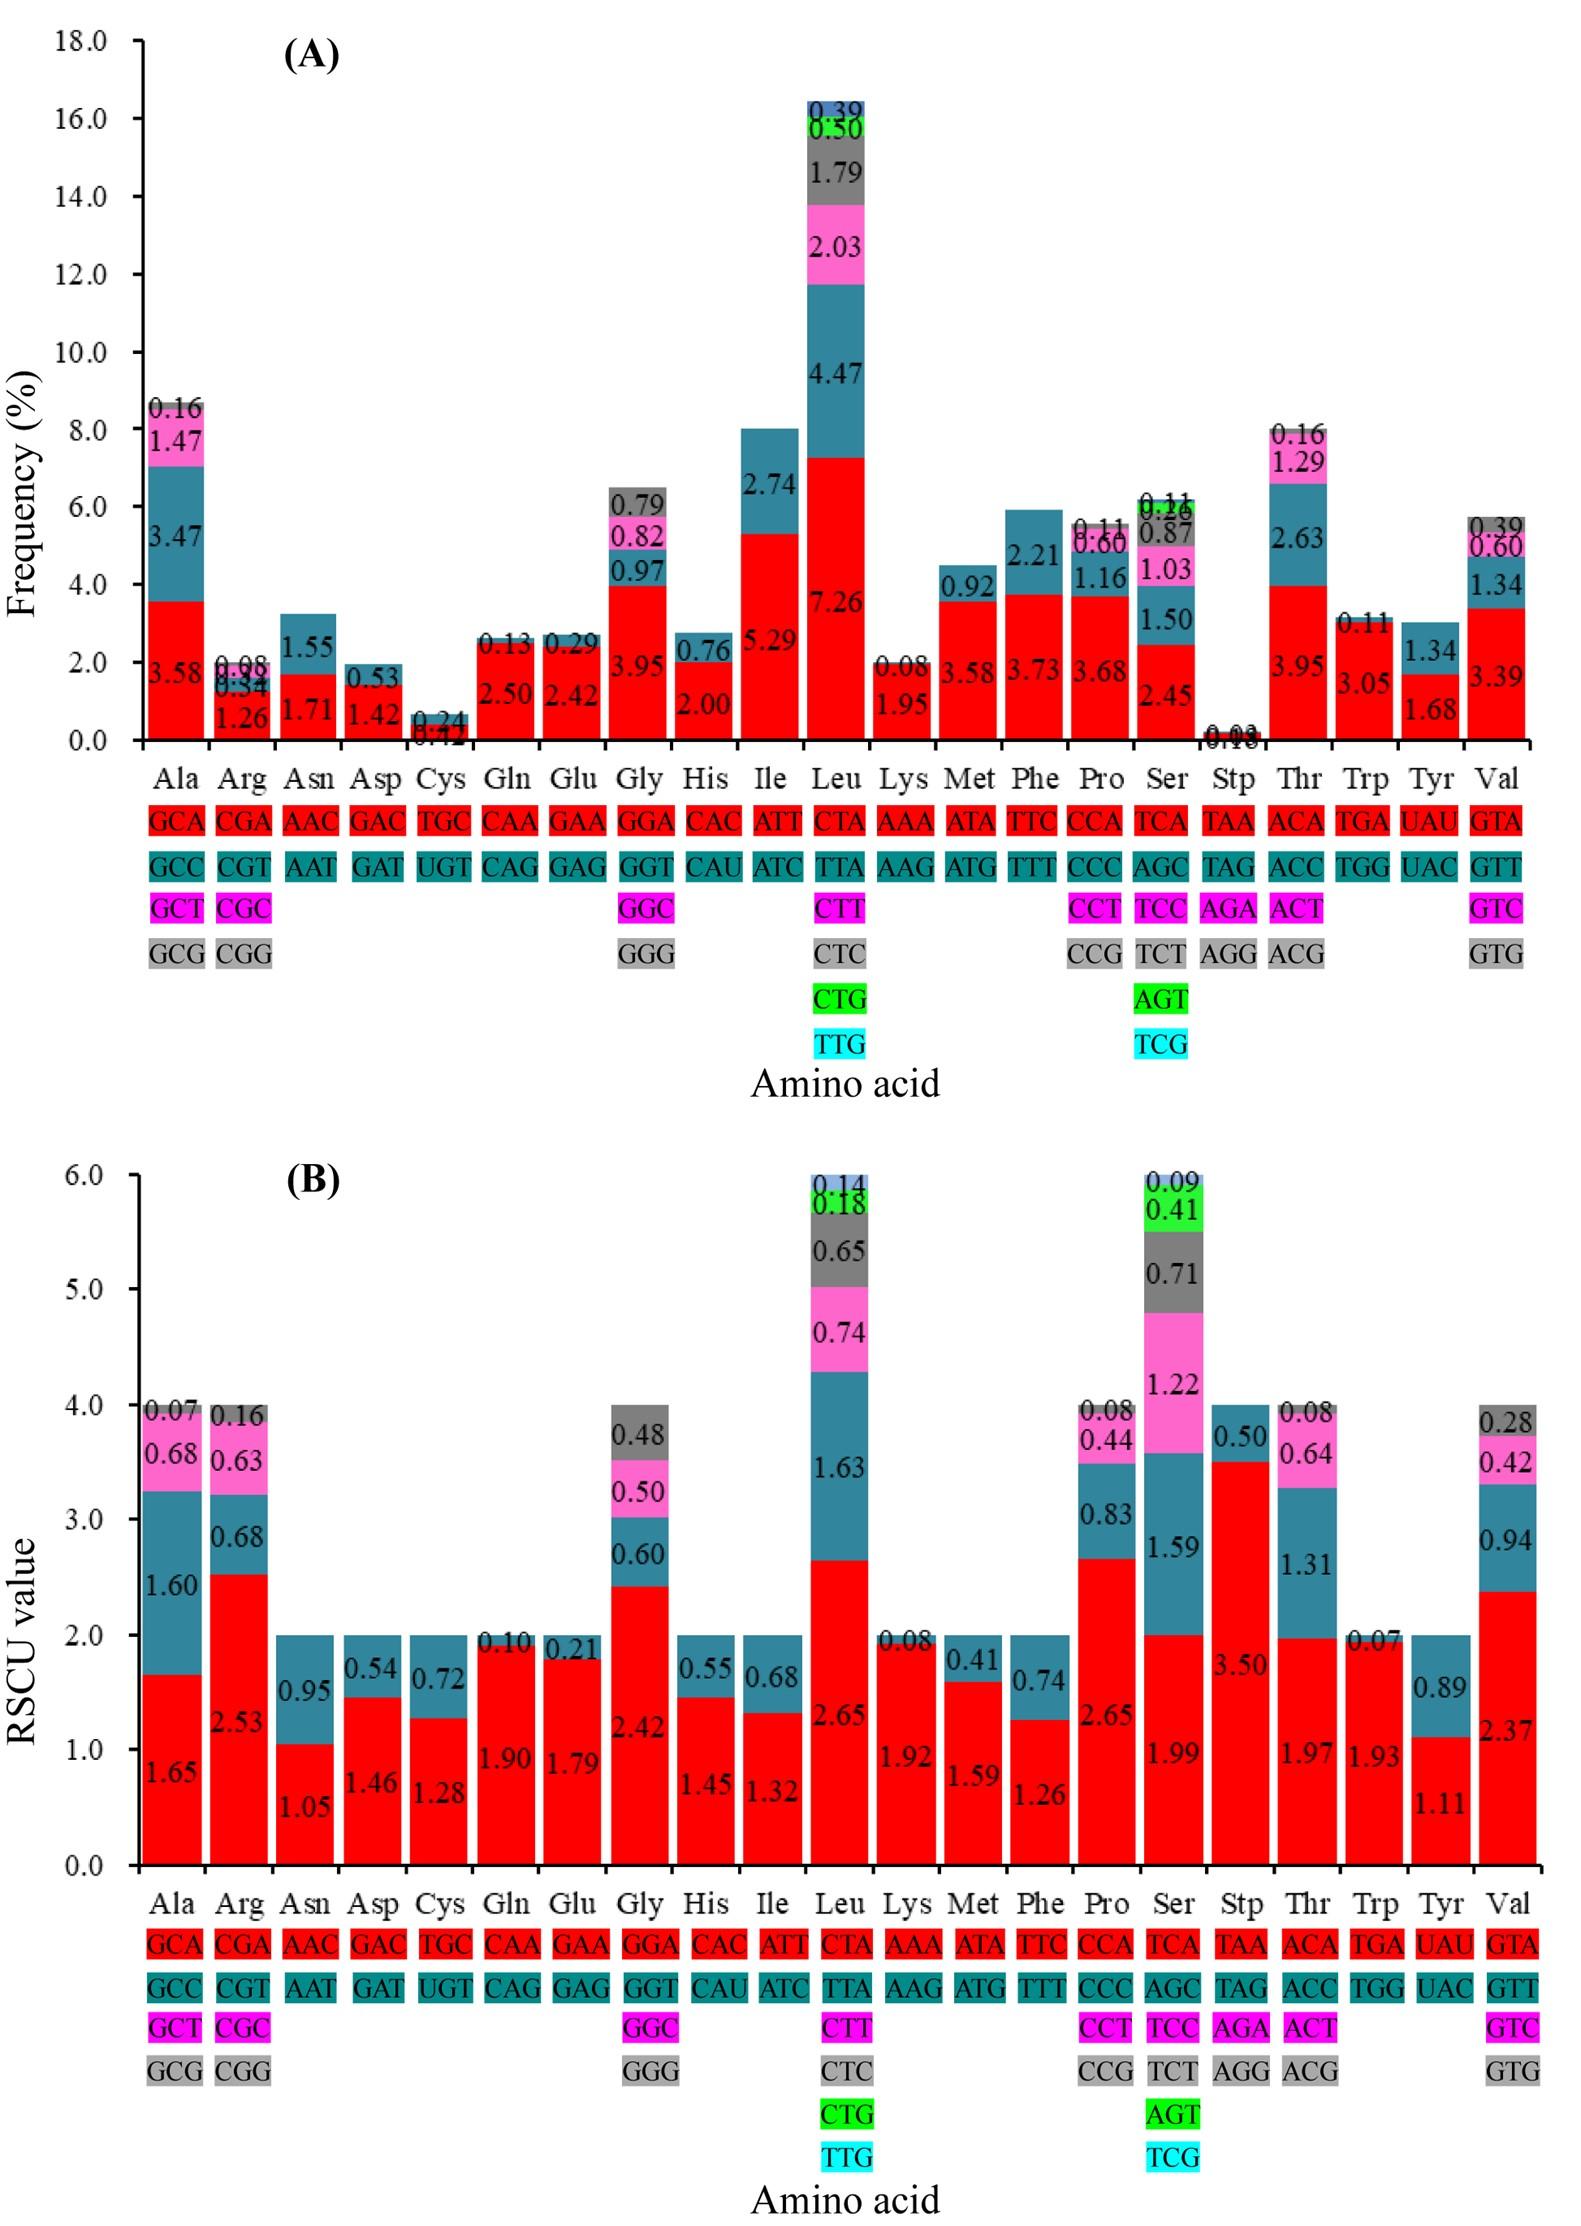
A total of 3802 codons were used for coding 20 amino acids by a standard set of 64 codons. The amino acids Leucine and Serine were encoded by six different codons, whereas rest of the amino acids was encoded by either two or four codons. The hydrophobic amino acid Lue (16.44 %) was utilized at the highest frequency followed by hydrophobic amino acids, Ala (8.68 %) and Ile/Thr (8.02 %), whereas the frequency of the hydrophilic amino acid, Cys (0.66 %) was the lowest among the 13 PCGs (Figure 3A). The most frequently used codon was CTA (7.26 %, Leu) followed by ATT (5.29 %, Ile) whereas, the rarely used codons were CGG (Arg), AGG (Lys), TCG (Ser), and TGG (Trp). The relative synonymous codon usage (RSCU) analysis revealed a total of 25 RSCU values with greater than 1.0 (Figure 3B). Several codons, GCA (Ala), CGA (Arg), CAA (Gln), GAA (Glu), GGA (Gly), CTA (Leu), TTA (Leu), AAA (Lys), CCA (Pro), TCA (Ser), ACA (Thr) and GTA (Val) were overpresented whereas the codons, GCG (Ala), CGG (Arg), GAT (Asp), CAG (Gln), CAC (His), TTG (Leu), CTG (Leu), AAG (Lys), ATG (Met), CCG (Pro), CCT (Pro), TCG (Ser), AGT (Ser), ACG (Thr), TGG (Trp), GTG (Val) and GTC (Val) were underpresented for coding the PCGs of the C. reba mitogenome.
Evolution rates of PCGs
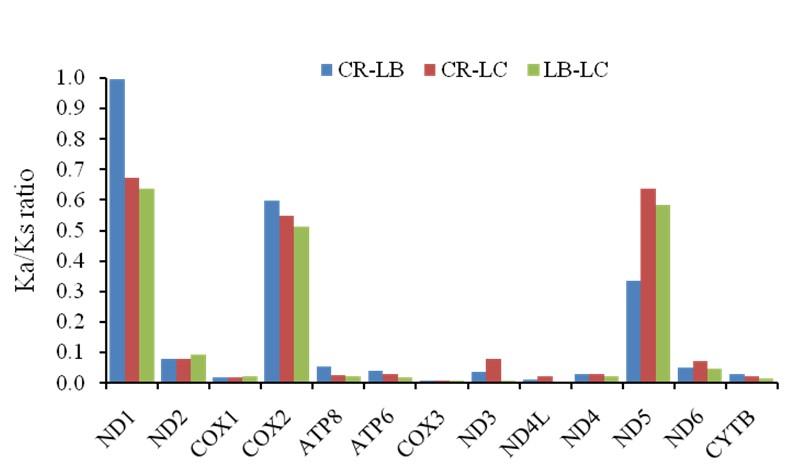
Sequences of the protein coding genes of C. reba were retrieved and evolution rates were estimated referring to the mitogenomes of its phylogenetic relatives, Labeo bata (GenBank accession no.: AP011198.1) and Labeo calbasu (GenBank accession no.: AP012143.1). The estimated Ka/Ks ratios also known as dN/dS ratios between C. reba and L. bata ranged from the lowest value (0.008) for COX1 gene to the highest value (0.997) for ND1 gene whereas, the values between C. reba and L. calbasu ranged from the lowest value (0.008) for COX3 gene to the highest value (0.673) for ND1 gene (Figure 4). The ND1 gene showed the higher Ka/Ks ratios comparing to that of other protein coding genes among the three fish species.
DISCUSSION
Nucleotide skew may be attributed to the equilibrium between mutation and selection pressures which are known to be affected by asymmetric mechanisms, largely of mtDNA replication, repair and to a lesser extent of transcription [25,26] which inferring the functionality of related genes. AT-skewness and GC-skewness are considered as a vital indicator to analyze strand asymmetry and the patterns of nucleotide composition of DNA sequences [27]. The lowest AT-skewness and highest GC-skewness value were observed in case of ND6, which was the only PCG exhibiting a positive value in the GC-skew curve and was common to other reports [26, 28, 29]. Mitochondrial genomes exhibit a strong strand-specific compositional bias [30] where heavy strand (H-strand) is guanine rich and light-strand (L- strand) is guanine poor [31]. In our analysis, ND6 which was located on the L- strand, showed larger fluctuation in AT/GC-skew value, suggesting that the selection and differential mutational pressure on this gene might be significantly different from other genes as reported in other fish species [26].
The second codon positions were reported with the over-representation of Ts in [11] and the coded amino acids might be related to a preference for nonpolar and hydrophobic amino acids in membrane-associated proteins [30]. The codons which possessed a T at the second position are coded for valine, liucine, isoliucine, alanine, phenylalanine, and methionine. These are nonpolar and hydrophobic amino acids [32; 33]. Codons ending with G or C at the 3rd position might have compositional constraint under mutation pressure. However, PCGs of C. reba might compromise with this type of constraint enabling higher mutation rates.
Codon usage pattern is exploited for those codons which are more quickly and efficiently translated into protein by the cellular machineries of an organism. However, translational selection is demonstrated in case of highly expressed genes by engaging codon usage patterns. The preferred codons usually occur at higher frequencies in the sequence of highly expressed genes than that in weakly expressed genes [1]. Recently, 30 RSCU values were reported in a cottoid fish [13]. In the present study, a total of 25 RSCU values were identified with the values of greater than 1. Besides, 12 codons were revealed as “overpresented” that implied to engage in highly expressed genes for efficient protein synthesis via translational selection.
All the 13 PCGs of three croakers were investigated for mutation rates in a study, where the Ka/Ks ratios ranged from 0.0100 to 0.2714 [13]. In that study, the Ka/Ks ratios indicated that the protein coding genes of those three fish species evolved under strong purifying selection [13]. Evolution of a DNA sequence is driven by non-adaptive forces including genetic drift and mutation pressure [34]. Under purifying selection, although, it is difficult to establish any mutations driven demerits, the selection pressures posed differently among the genes and are supposed to evolve in different ways [34]. Ka/Ks ratio between C. reba and L. bata was close to one which meant neutral mutation in ND1 gene of C. reba implying neither beneficial nor detrimental to its survival or reproduction. Except for ND1, COX2 and ND5, all the values of Ka/Ks ratios were less than 0.1. However, we can consider that the mutation occurred in these PCGs of C. reba was driven by purifying or negative selection. Negative selection indicates prevalence of more synonymous mutations than non-synonymous mutations where ancestral state and/or more diverse gene pool is essential to conserve for appropriate functions of encoded proteins. If negative selection is unable to remove the harmful mutations, an accumulation of deleterious mutations occurs [6]. If the negative selection is too strong in the whole population or hard selection occurs that reduce the number of surviving offspring, the possibility of extinction will increase. Climate changes and/or habitat alterations are responsible for threatening of those species under strong negative selection.
CONCLUSION
The mutation in PCGs of C. reba dominated the synonymous substitutions among its relatives which might contribute to the genetic stability and diversity of this threatened labeonine fish. The overpresenting codons indicating the functions of genes under translational selection might influence the life cycle of the fish species. Research works should be conducted linking the environmental conditions and nutritional requirements along with the major causes of threatened/endangered state of the fish species. For the conservation of the populations of C. reba, different strategies should be considered, e.g., in situ conservation by installing fish sanctuary, ex situ conservation by adopting artificial breeding program, stopping, or prohibiting indiscriminate use of insecticides, fertilizers in agricultural fields, practices of bioremediation, treating industrial effluents before mixing to the water bodies for decreasing pollution of their habitats and breeding grounds.
ACKNOWLEDGEMENTS
We are highly thankful to the assigned reviewers for their constructive critiques, suggestions, and comments to improve the manuscript.
AUTHOR CONTRIBUTIONS
MNI designed the outlines of the manuscript and drafted the original manuscript. MNI and SS performed the formal analysis of the data. MNI and SS wrote, revised and edited the manuscript.
CONFLICTS OF INTEREST
There is no conflict of interest among the authors.
References
- [1]Jia W, Higgs PG. Codon usage in mitochondrial genomes: distinguishing context-dependent mutation from translational selection. Mol Biol Evol 2008; 25(2):339-51.
- [2]Urbina D, Tang B, Higgs PG. The response of amino acid frequencies to directional mutation pressure in mitochondrial genome sequences is related to the physical properties of the amino acids and to the structure of the genetic code. J Mol Evol 2006; 62(3):340-61.
- [3]Faith JJ, Pollock DD. Likelihood analysis of asymmetrical mutation bias gradients in vertebrate mitochondrial genomes. Genet 2003; 165(2):735-45.
- [4]Billington N, Hebert PD. Mitochondrial DNA diversity in fishes and its implications for introductions. Canadian J Fish Aquat Sci 1991; 48(S1):80-94.
- [5]Kimura M. Evolutionary rate at the molecular level. Nature publishing group [Internet], 1968; 217 (5129): 624–626.
- [6]Loewe L. Negative Selection. Nature Education 2008; 1 (1): 59.
- [7]Glémin S. How are deleterious mutations purged? Drift versus nonrandom mating. Evolution 2003; 57(12):2678-87.
- [8]Charlesworth B, Morgan MT, Charlesworth D. The effect of deleterious mutations on neutral molecular variation. Genet 1993; 134(4):1289-303.
- [9]Sahoo S, Das SS, Rakshit R. Codon usage pattern and predicted gene expression in Arabidopsis thaliana. Gene 2019; 721:100012.
- [10]Bangladesh IUCN. Red List of Bangladesh Volume 5: Freshwater Fishes. IUCN, International Union for Conservation of Nature, Bangladesh Country Office, Dhaka, Bangladesh. 2015; 16:360.
- [11]Islam MN, Sultana S, Alam MJ. Sequencing and annotation of the complete mitochondrial genome of a threatened labeonine fish, Cirrhinus reba. Genomics Inform 2020; 18(3). e32. doi: 10.5808/GI.2020.18.3.e32.
- [12]Perna NT, Kocher TD. Patterns of nucleotide composition at fourfold degenerate sites of animal mitochondrial genomes. J Mol Evol 1995; 41(3):353-8.
- [13]Yang H, Xia J, Zhang JE, Yang J, Zhao H, Wang Q, Sun J, Xue H, Wu Y, Chen J, Huang J. Characterization of the complete mitochondrial genome sequences of three croakers (perciformes, sciaenidae) and novel insights into the phylogenetics. Int J Mol Sci 2018; 19(6):1741.
- [14]Sharp PM, Li WH. The codon adaptation index-a measure of directional synonymous codon usage bias, and its potential applications. Nucleic Acids Res 1987; 15(3):1281-95.
- [15]Wright F. The ‘effective number of codons’ used in a gene. Gene 1990; 87(1):23-9.
- [16]Fuglsang A. The ‘effective number of codons’ revisited. Biochem Biophys Res Commun 2004; 317(3):957-64.
- [17]Gouy M, Gautier C. Codon usage in bacteria: correlation with gene expressivity. Nucleic Acids Res 1982; 0(22):7055-74.
- [18]Ikemura T. Codon usage and tRNA content in unicellular and multicellular organisms. Mol Biol Evol 1985; 2(1):13-34.
- [19]Kumar S, Stecher G, Tamura K. MEGA7: Molecular Evolutionary Genetics Analysis version 7.0 for bigger datasets. Mol Biol Evol 2016; 33:1870–1874.
- [20]Sharp PM, Tuohy TM, Mosurski KR. Codon usage in yeast: cluster analysis clearly differentiates highly and lowly expressed genes. Nucleic Acids Res 1986; 14(13):5125-43.
- [21]He Z, Gan H, Liang X. Analysis of synonymous codon usage bias in potato virus M and Its adaption to hosts. Viruses 2019; 11(8):752.
- [22]Gupta SK, Ghosh TC. Gene expressivity is the main factor in dictating the codon usage variation among the genes in Pseudomonas aeruginosa. Gene 2001; 273(1):63-70.
- [23]Hurst LD. The Ka/Ks ratio: diagnosing the form of sequence evolution. Trends Genet: TIG 2002; 18(9):486-.
- [24]Korber B. HIV Signature and Sequence Variation Analysis. In: Rodrigo AG and Learn GH (eds). Computational Analysis of HIV Molecular Sequences. Kluwer Academic Publishers: Dordrecht, Netherlands, 2000, pp 55-72.
- [25]Fonseca MM, Harris DJ, Posada D. The inversion of the control region in three mitogenomes provides further evidence for an asymmetric model of vertebrate mtDNA replication. PLoS One 2014; 9(9):e106654.
- [26]Ruan H, Li M, Li Z, Huang J, Chen W, Sun J, Liu L, Zou K. Comparative analysis of complete mitochondrial genomes of three Gerres fishes (Perciformes: Gerreidae) and primary exploration of their evolution history. Int J Mol Sci 2020; 21(5):1874.
- [27]Lü Z, Zhu K, Jiang H, Lu X, Liu B, Ye Y, Jiang L, Liu L, Gong L. Complete mitochondrial genome of Ophichthus brevicaudatus reveals novel gene order and phylogenetic relationships of Anguilliformes. Int J Biol Macromol 2019; 135:609-18.
- [28]Mu X, Liu Y, Lai M, Song H, Wang X, Hu Y, Luo J. Characterization of the Macropodus opercularis complete mitochondrial genome and family Channidae taxonomy using Illumina-based de novo transcriptome sequencing. Gene 2015; 559(2):189-95.
- [29]Boore JL. Requirements and standards for organelle genome databases. Omics: J Integ Biol 2006; 10(2):119-26.
- [30]Asakawa S, Kumazawa Y, Araki T, Himeno H, Miura KI, Watanabe K. Strand-specific nucleotide composition bias in echinoderm and vertebrate mitochondrial genomes. J Mol Evol 1991; 32(6):511-20.
- [31]Anderson S, Bankier AT, Barrell BG, de Bruijn MH, Coulson AR, Drouin J, Eperon IC, Nierlich DP, Roe BA, Sanger F, Schreier PH. Sequence and organization of the human mitochondrial genome. Nature 1981; 290(5806):457-65.
- [32]Junqueira AC, Lessinger AC, Torres TT, da Silva FR, Vettore AL, Arruda P, Espin AM. The mitochondrial genome of the blowfly Chrysomya chloropyga (Diptera: Calliphoridae). Gene 2004; 339:7-15.
- [33]Helfenbein KG, Brown WM, Boore JL. The complete mitochondrial genome of the articulate brachiopod Terebratalia transversa. Mol Biol Evol 2001; 18(9):1734-44.
- [34]Lynch M, Koskella B, Schaack S. Mutation pressure and the evolution of organelle genomic architecture. Science 2006; 311(5768):1727-30.