RAPD-markers assisted genetic diversity analysis and Bt-Cry1Ac gene identification in eggplant (Solanum melongena L.)
Abstract
Generic diversity (GD) screening helps to identify candidate genes involved in diseases, pests, or other stress resistance in plants. GD is crucial for maintaining vigor and healthy plant population. The random amplified polymorphic DNA (RAPD) is a rapid polymerase chain reaction (PCR)-based molecular marker, effective for screening genetic diversity in diverse plant species. In this study, we applied the RAPD-markers-assisted PCR approach to explore genetic diversity (GD) among 7 varieties of eggplant (Solanum melongena L.) at DNA level. Further, we assessed the presence of Bt-Cry1Ac gene in those varieties using the PCR approach. The eggplants showed genetic diversity at the DNA level. The amplification with two RAPD primers (OPA-02, OPA-04) produced a total of 41 bands. The highest similarity showed 78.57% among sample 4 (Eggplant China) vs sample 7 (Purple king F1) and sample 1 (Eggplant Srilanka) vs sample 4 (Eggplant China), while the lowest was 28.57% among sample 7 (Purple king F1) vs sample 3 (Eggplant Chittagong-1). In addition, the PCR results for the Bt Cry1Ac primer did not show a considerable band in the expected amplicon size. The dendrogram showed the genetic variability and relationship among all seven eggplant varieties at the genetic level. The study formulated a simple marker-based method for an effective molecular protocol to study genetics in eggplants. It also reported the presence of the Bt gene in popular eggplant varieties.
Keywords
INTRODUCTION
Eggplant (Solanum melongena L.) is a member of the Solanaceae family, and the fifth most economically important vegetable crop after potato, tomato, pepper, and tobacco [1]. Most of the current cultivars of eggplants are F1 hybrid [2]. There is little genetic diversity known among and within cultivated eggplants, and the hybrid varieties increase narrow genetic variation. Additionally, varietal discrimination and identification of GD with disease resistance efficiency are very challenging. Therefore, effective molecular strategies are crucial for varietal differentiation and screening disease resistance efficiency in eggplants.
GD and varietal identification in vegetable plants have been investigated in several studies using SSR and SNP markers, isozyme, and protein polymorphism [1, 3-5]. In addition, other molecular approaches including restriction fragment length polymorphism (RFLP) and PCR-based markers have been extensively used for the authentication of closely related horticultural and medicinal plant varieties [6-8]. Hints, the RFLP-markers show a high level of polymorphism and stability but this approach may raise limitations due to high cost and complexity [9].
In this context, the DNA technique of PCR-based methods is accurate, rapid, and cost-effective for the determination of genetic diversity among the plant varieties [10]. The effectiveness of polymorphism identification through PCR-based methods has been validated in several eggplant cultivars [11, 12]. Among the PCR-based markers, the randomly amplified polymorphic DNA (RAPD) is an effective, handy, and accurate method and it can be handled without deep knowledge and understanding of genome sequence. Nowadays, this method is frequently used as a routine assessment of varietal diversity and/or test of seed purity in numerous crop species [8, 11, 12].
With these advancements in genetic diversity assessment using molecular-marker-assisted approaches, it is also imperative to explore disease-tolerant novel or new promising candidate genes, as eggplants face several diseases caused by insect pests. Therefore, effective molecular strategies are crucial for enhancing insect resistance in eggplants. The Bacillus thuringiensis (Bt), a common and eco-friendly soil bacterium that is applied as biological pest management in granular or powder form, is the source of the Cry1Ac gene [13]. The Cry1Ac crystal protein gene, which encodes an insecticidal protein shows resistance to Fruit and Shoot Borer (FSB) attract in eggplants [13]. Therefore, exploring genetic diversity combined with Cry1Ac gene assessment in eggplant would be a promising approach for sustainable eggplant cultivation. In this study, we conducted the RAPD-markers-assisted screening of genetic diversity and Bt-Cry1Ac gene identification in eggplant using several commercial varieties.
MATERIALS AND METHODS
Germination and growth conditions for hydroponic culture
Eggplant seeds were surface sterilized with 70% ethanol for 5 min before being placed in a germinating petri dish supplemented with distilled water. The seeds were then germinated on moist tissue paper wetted with deionized water for 3-4 days in the dark at room temperature. Only healthy and uniform seedlings were transplanted to solution culture. A basal nutrient Hoagland solution [14] was used with the following nutrient concentrations (μM): KNO3 (16000), Ca(NO)3.4H2O (6000), NH4H2PO4 (4000). MgSO4.7H2O (2000), KCI (50), H3BO3 (25), Fe-EDTA (25), MnSO4.7H₂O (2). Na2MoO4.2H2O (0.5), CuSO4.5H2O (0.5) and Zn as ZnSO4 (2.0) mM. The pH of the medium was adjusted to 6.0 using KOH (1M). The plants were kept in the growth chamber at 25°C having 60% relative humidity, 200 μmol-2s-1 light intensity, and long-day light conditions (14 h light/10 h dark). The plants were harvested 3 weeks after cultivating to the hydroponic culture. A total of 7 eggplant varieties were used for this study, their sample number, variety name, and sample number were presented in Table 1.
Table 1. Name of the verities and their sample number.
Genomic DNA isolation
Genomic DNA was isolated from the roots of the Eggplant following the manufacturer’s guidelines of Wizard® Genomic DNA Purification Kit. Briefly, 40mg of this leaf powder to a 1.5 ml micro-centrifuge tube homogenized with 600µl of nuclei lysis solution, vortexed 1–3 sec., and incubated at 65°C for 15 min. Total 3µl of RNase solution to the cell lysate and mixed the sample by inverting the tube 2–5 times. The mixture was incubated at 37°C for 15 min then cooled at room temperature for 5 min. Subsequently, 200µl of protein precipitation solution, and vortexed vigorously at 13,000 × g for 20 secs, and centrifuged again at 13,000–16,000 × g for 3 min. The supernatant containing the DNA (leaving the protein pellet behind) and transferred to a clean 1.5ml micro-centrifuge tube containing 600µl of isopropanol. The mixture was centrifuged at 13,000–16,000 × g for 1 min at room temperature. The supernatant was added with 600µl of 70% ethanol and carefully washed the extracted DNA. The DNA pellet was air-dried for 5 min, then 100µl of DNA rehydration solution collected the DNA yield, and the DNA at -20 °C until further experiment.
Agarose gel electrophoresis
A total of 1g of agarose powder was weighed and mixed with 100 mL of 1x TBE buffer in a microwavable flask. The agarose mixture was milted using a microwave until it completely dissolved. Subsequently, the 6.5µl of ethidium bromide (EtBr) was added to the agarose solution the mixture temperate declined at a comfortable level, poured into a horizontal gel casting tray for solidification. The solidified gel was placed into 1% TBE buffer. Carefully loaded a molecular ladder into the first lane, followed by plant samples. The gel was run at 100 V for 10-15 min, following the termination of electrophoresis the DNA bands were observed on the UV-light system.
PCR amplification of RAPD primers
Among twenty RAPD primers (OPA-01 to OPA-20), two primers viz. OPA-02 (5´-TGC CGA GCT G-3´) and OPA-04 (5´-AAT CGG GCT G-3´) were used for amplifications (Table 2). The PCR master mix containing GoTaq® G2 Hot Start Polymerase, dNTPs, and MgCl2 was used as common for this amplification program. The eggplant DNA samples were added separately. The PCR condition was programmed at 94oc for 1 min, 34oc for 1 min, and 72oc for 1 min these steps were repeated for 45 cycles, and the extension at 72oc for 7 min.
Table 2. Details of (OPA-02 and OPA-04) RAPD primers.
Band pattern and scoring
The PCR amplified product of samples were visualized, subsequently these samples were prepared for genetic diversity analyses. The scored of amplification products were recorded separately based on the primers corresponding bands. The binary code 1 and 0 indicate the presence or absence of a band, respectively. On the basis of the absence and presence of the RAPD band and statistical data, the similarity coefficient matrix among the 7 eggplant accessions were measured following the formula of Jaccard similarity index [15].
Similarity Index (SI)=Number of matching bands in two lanes compared ÷ Total number of bands
A dendrogram was prepared based on bands scored in RAPD gels through SAHN clustering analysis. The numerical taxonomic patterns DNA fragment analysis was analysed using the NTSYS-pc software [16].
Screening of Bt-Cry1Ac gene
The gene sequence was retrieved from the NCBI database and NCBI Primer designing web tool was utilized to pick primer pairs with non-self-complementary, no hairpin and compatible with each other. Gene runner software was used to check the primer parameter. The Bt-Cry1Ac gene-specific primers were used for this experiment (Table 3). To make 100Mm primer concentration, Bt-Cry1Ac Gene primer was diluted by adding the required amount of nuclease-free water with the lyophilized primer and kept the tube at 4 ºC temperature for 15 min. Then 5µl of 100 mmol primer was taken in a new micro-centrifuge tube and diluted to 5 mmol by adding 95µl of nuclease-free water. A total of 1 µl DNA sample was taken into a microcentrifuge tube and 9 µl nuclease-free water. Then mixed perfectly and these diluted DNA samples were used as templates for PCR.
Table 3. Primer properties of the Bt-Cry1Ac gene.
Polymerase chain reaction (PCR) for Bt-Cry1Ac gene
The PCR condition was set up based on primer and gene properties. To evaluate the expression of the BTCry1Ac gene, it was amplified with specific primers from each of the genomic DNA samples (Table 3). The initial reaction volume was kept at 10µl. If the product was compatible with the desired size and density, the 50µl reaction containing 25μl of GoTaq® G2 Hot Start Green Master Mix, 2.5μl forward primer, 2.5μl reverse primer, 1μl DNA template, and 3μl nuclease-free water were set for PCR amplification. The PCR conditions were programmed at 94oc for 45 secs, 58 oC for 45 secs, 72 oC for 45 secs, and 72 oC for 5 min, these steps were repeated for 35 cycles, and the extension at 72oc for 7 mins.
RESULTS
Visualization of extracted DNA
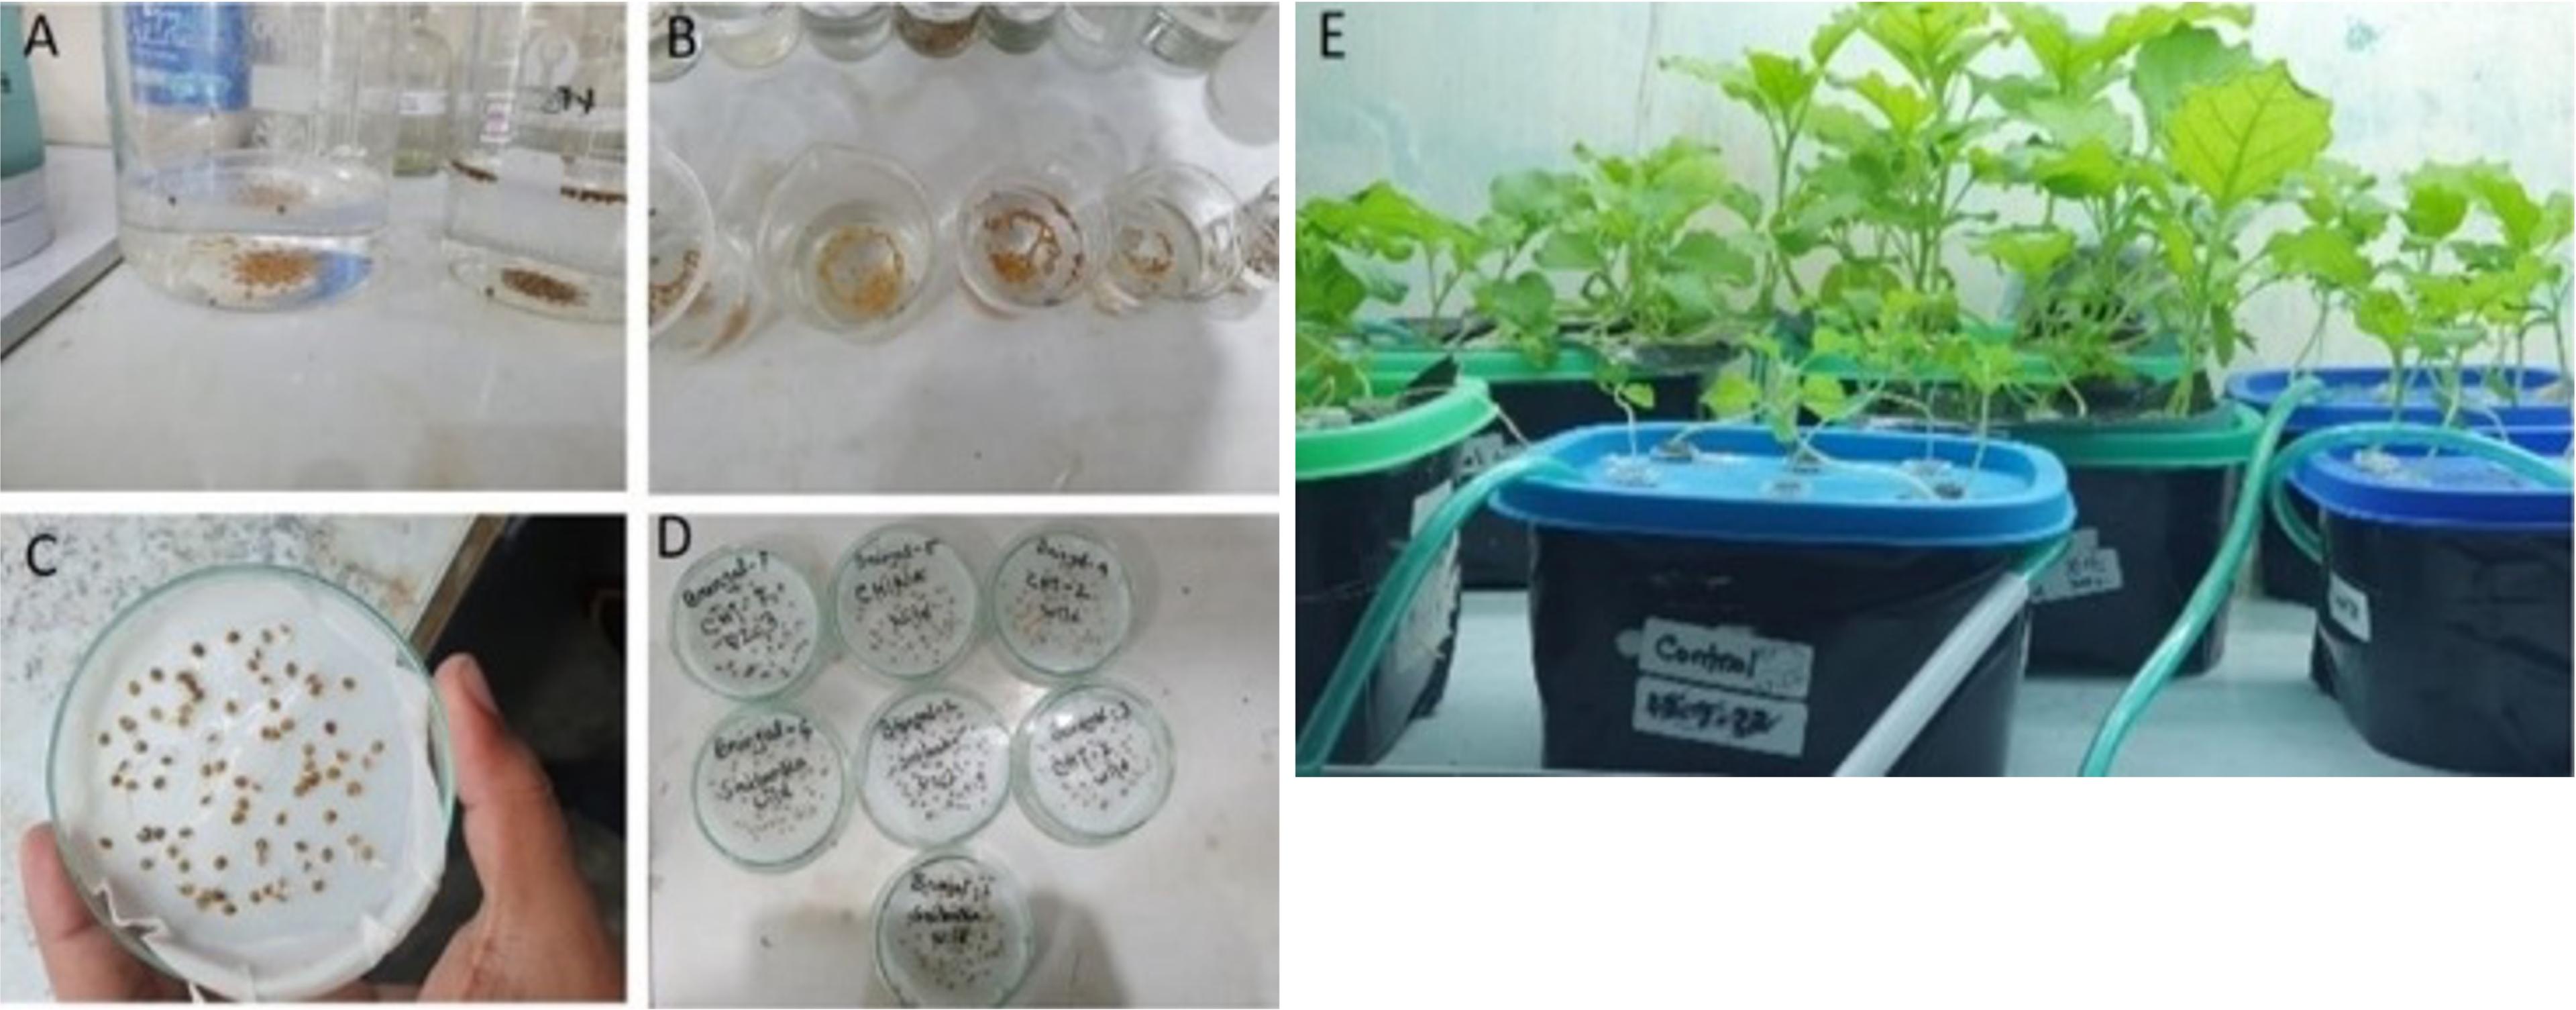
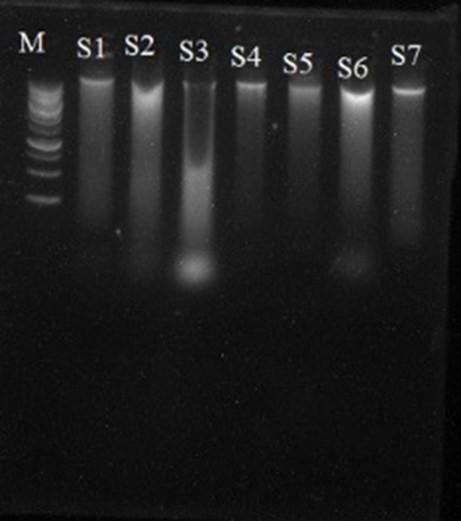
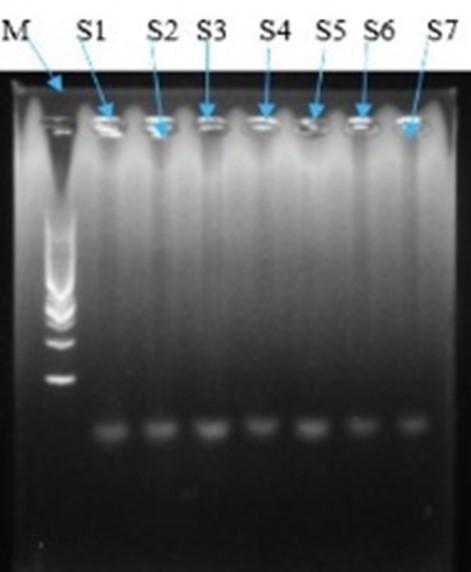
The plant samples were collected by growing the eggplant seedlings in a hydroponic culture (Figure 1). The plant genomic DNA was extracted from the roots of all seven sample plants. Then the yielded DNA products were visualized on agarose gel electrophoresis (1% w/v) that confirmed the quality of DNA (Figure 2). Concentration and DNA yield were determined by comparing the intensity of extracted DNA.
DNA fingerprinting using RAPD markers
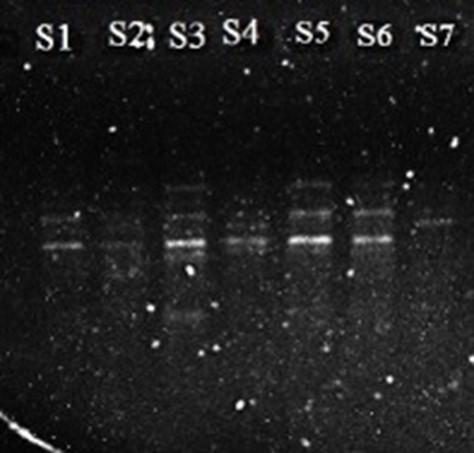
The 7 eggplant varieties were identified when they were compared with the results of RAPD experiments. The RAPD technique showed efficient DNA sequence-based polymorphisms at a very large number of loci. DNA fingerprinting of the 7 eggplant varieties were performed using the two RAPD markers were confirmed by OPA-02 and OPA-04 primers. The amplified PCR products showed different bands on 1% agarose gel electrophoresis under UV trans-illuminator. The results of PCR amplification bands were presented based on two distinct primers, respectively (Figure 3 and 4).
Band scoring
The two primers generated a total of 41 bands from the seven eggplant varieties were confirmed by the Thermal Cycler (Labnet, USA) in 1% agarose gel electrophoresis. Representative electropherograms according to primers OPA-02 and OPA-04 were shown in Figures 3 and 4 respectively. For the two primers, the total number of bands were 41. The number of bands for OPA-02 primer were 20, and for OPA-04 were 21 (Table 4 and 5).
Table 4.. Band scoring from the agarose gel visualization of seven eggplant varieties using OPA-02 and OPA-04 RAPD primers.
Table 5. RAPD primers with corresponding bands scored number of monomorphic and polymorphic bands per variety in seven eggplant varieties.
Similarity coefficient
The pairwise Jacard’s coefficients for the genetic similarities among the 7 genotypes were presented in Table 6. The values of the coefficients were estimated based on two RAPD primers. The similarity ranges from 28.57% (between sample 7 and sample 3) to 78.57% (between sample 1 and sample 4, and sample 7 and sample 4 (Table 6).
Table 6. Estimated Jaccard’s similarity coefficient of 7 varieties of eggplant using RAPD data.
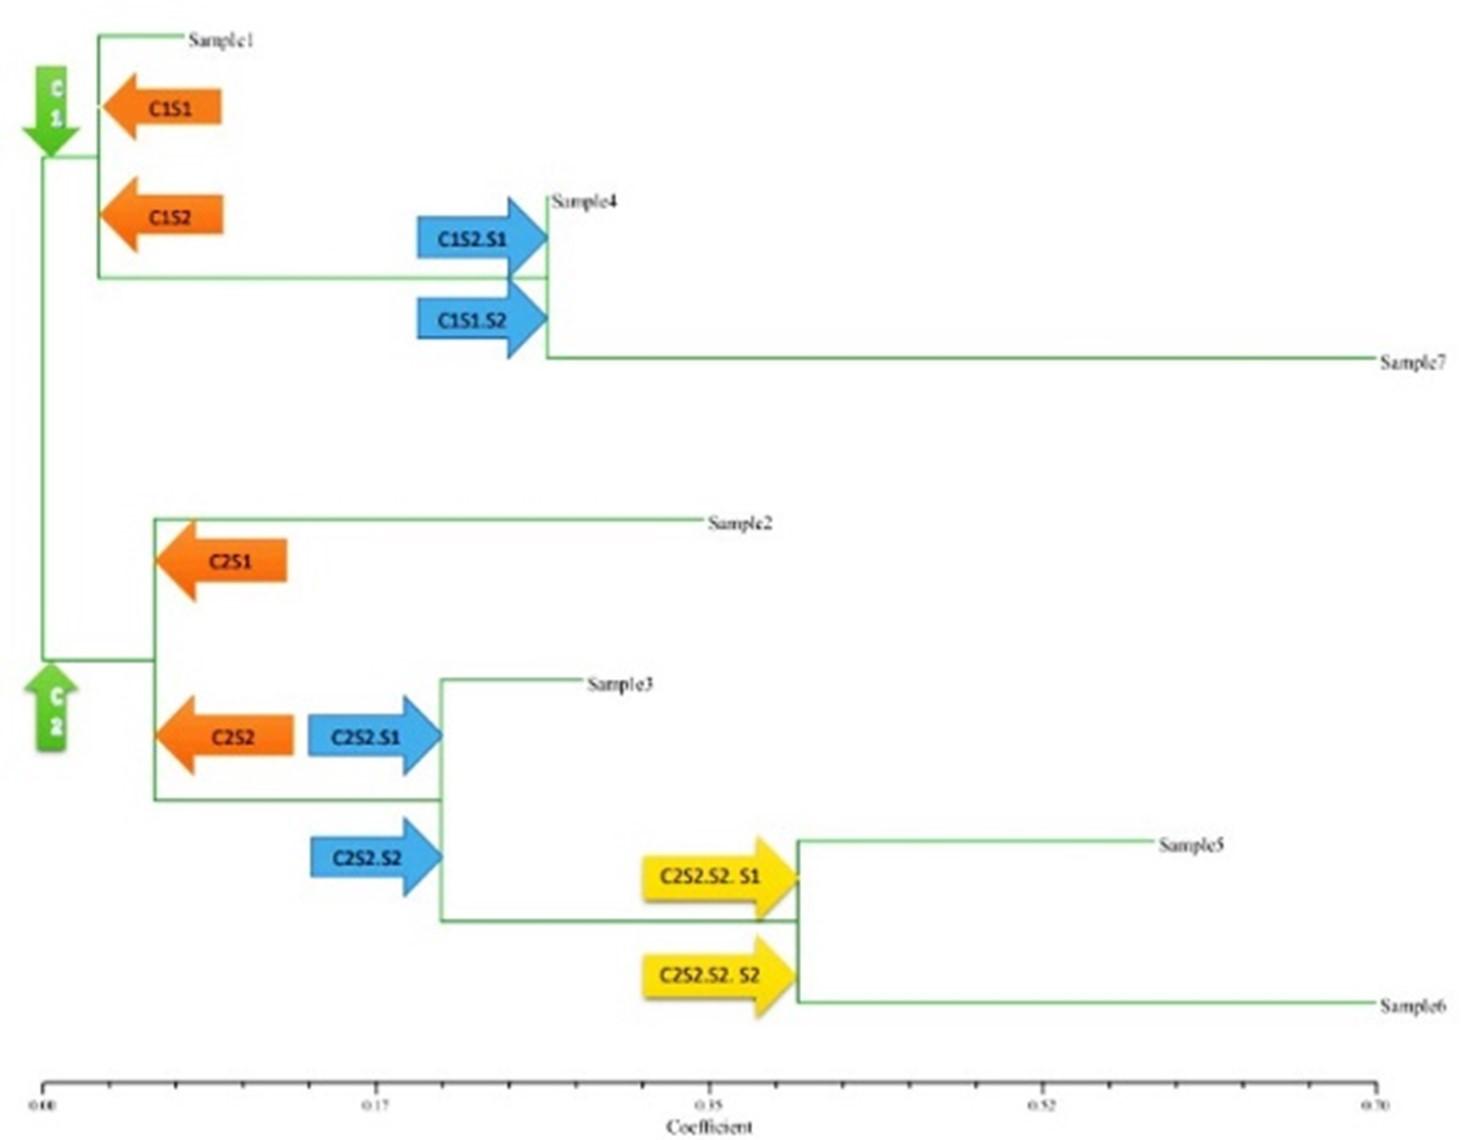
Analysis of clusters
A dendrogram was prepared based on the PCR amplification outputs. The phylogenetic tree was created to screen the relationship among of eggplant varieties (Figure 5). The distinction was found among the eggplant varieties while analyzed the major clusters viz., C1 and C2. C1 was again divided into two sub-cluster viz., C1S1 and C1S2. The C1S1 contains sample1 (Eggplant Srilanka). The C1S1(cluster1-subcluster 2) was again divided into two sub-cluster viz., C1 S2 and S1, which contains sample 4 (Eggplant China), and C1S2.S2 contains sample 7 (Purple King F1). In this cluster sample 1, sample 4, and sample 7 is related to each other and sample 4 and sample 7 was closely related.C2 (cluster 2) was primarily divided into two sub-cluster named C2 S1 and C2S2. The C2S1 contains sample 2 (Eggplant Chittagong-2). The C2S2 was again divided into two sub-cluster named C2S2.S1 and C2S2.S2. Here, C2S2.S1 contains sample 3(Eggplant Chittagong-1). C2S2.S2 was again divided into two sub-cluster named C2S2.S2. S1 and C2S2.S2. S2. C2S2.S2. S1 contains sample 5(BH-1 Super Sraboni) and C2S2.S2. S2 contains sample 6 (BNB-422F1). This cluster contains sample 2, sample 3, sample 5, and sample 6 where sample 2 were related to other samples in this cluster. Sample 3 was related to sample 5 and sample 6, and the sample 5 and sample 6 were closely related.
PCR amplification of BT Cry1Ac gene
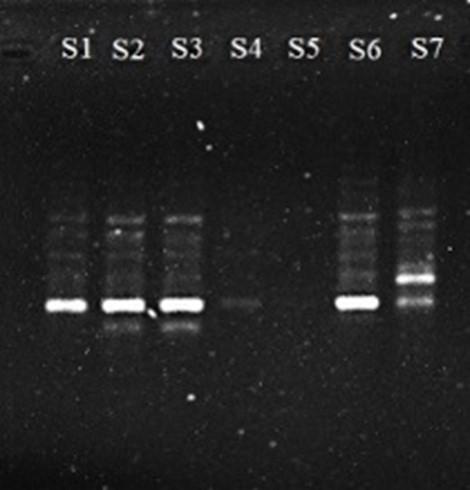
Polymerase chain reaction (PCR) amplified a single copy or a few copies of a specific segment of DNA or gene in millions of copies of that DNA segment or gene. For amplification of target regions of the Bt-Cry1Ac gene PCR was conducted and to ensure the presence of accurate size of PCR product, amplified products were visualized in 1% agarose gel electrophoresis under UV trans-illuminator. The PCR amplification produced confirmed the presence of Bt-Cry1Ac genes in 7 eggplant varieties, wherein S3 and S5 showed dominant expression of Bt-Cry1Ac (Figure 6).
DISCUSSION
This study implies the insights of RAPD-PCR based genetic diversity among 7 eggplant varieties. Interestingly, the presence of Bt-Cry1Ac was found in the studied verities. The seven different varieties of eggplant such as Eggplant Srilanka, Eggplant Chittagong-2, Eggplant Chittagong-1, Eggplant China, BH-1 Super Sraboni, BNB-422F1, Purple king F1 showed the good quality of DNA that was enough for RAPD analyses. These findings suggest that eggplant is suitable species for genetic diversity analysis and diversity analyses were conducted in other vegetable crops including tomato, capsicum and potato [5, 17].
The genetic variations in seven natural eggplant varieties were analyzed by amplifying the genomic DNA by polymerase chain reaction (PCR) using two RAPD primers OPA-02, and OPA-04. All two RAPD primers produced the maximum number of high-intensity bands with minimal smearing in DNA fingerprints. Using two RAPD primers, a total of 41 bands were produced of which 41 were found to be polymorphic and the primers generated 20.5 polymorphic bands per primer. The mean number of polymorphic bands per primers was higher which obtained by the other researchers in tomato plants [17]. In our current study in eggplants, the primers were differentially amplified in different eggplant cultivars but showed low polymorphism at molecular level. The low degree of polymorphisms indicates there was low divergence among the eggplant varieties. However, the percentage distribution of RAPD marker always indicate a distribution level, frequency of rare alleles which are either similar or not to commercial of landrace accessions [18].
The pairwise Jacard’s coefficients for the genetic similarities indicated the frequencies of polymorphic markers for genetic relationship among the 7 eggplant varieties using the unweighted pair group method of arithmetic means (UPGMA). The values of pair-wise localization showed a comparison of genetic distances, numerical phylogenetic relationship of 7 eggplant varieties. The Jaccard Similarity coefficients approach provide similarities of sparse binary data sets while the it receipts the common or split components of in two sets [19]. In our eggplants study, we noticed that the highest similarity was shown in the case of sample 1 and sample 4 and sample 7 and sample 4. The lowest similarity was reported in the case of varieties pairs sample 7 and sample 3 of eggplants.
Dendrogram based cluster with linkage analyses is a suitable approach that has been used in deterring tomato phenotypic traits[20]. In this current study, dendrogram based on linkage distance indicated the segregation of the seven eggplant varieties into two main clusters C1 and C2. C1 was again divided into two sub-cluster viz., C1S1 and C1S2. C1S1 contains a sample1(Eggplant Srilanka) which was distinct from others. The sub-cluster C1S1 was formed by sample 4 (Eggplant China) and sample 7(Purple king F1).C2S2 contains sample 2 (Eggplant Chittagong-2) which were distinct in this cluster also sample 5 (BH-1 Super Sraboni and sample 6(BNB-422F1) contract the cluster C2S2. The data obtained in this study also confirmed the efficiency of the RAPD technique for the determination of genetic distances and relatedness among different eggplant varieties [21]. Interestingly, the primer design for the screening of the presence of the Bt-gene among all seven varieties of eggplant using polymerase chain reaction (PCR) showed only primer dimer. Initially, the eggplant showed the band of Bt-genes, suggesting that eggplant would be promising for studying resistance against insect pests. The further studies are required at lab to field levels.
CONCLUSIONS
This study provides molecular insights of genetic diversity screening in eggplants using RAPD- molecular markers. In this current study, the RAPD marker technique explored the genetic diversity among 7 eggplant varieties, along with initial confirmation of Bt-gene in eggplants. The RAPD analysis showed all 7 samples of eggplant divided into two major clusters and those clusters are also divided into several sub-clusters. In the dendrogram sample 1(Eggplant Srilanka) and sample 2(Eggplant Chittagong-2) were distinct into two major clusters. Cluster-1 showed the sample 1(Eggplant Srilanka) that was genetically related to sample 4(Eggplant China) and sample 7(Purple King F1). Cluster-2 also showed the sample 2(Eggplant Chittagong-2) was genetically related to sample 5(BH-1 Super Sraboni) and sample 6(BNB-422F1). This study further suggests that the study of Bt-Cry1Ac gene in egg plant would be promising. The overall molecular insights indicate that RAPD-markers could be efficiently used for genetic diversity analyses in eggplants and other horticultural plant species.
ACKNOWLEDGMENT
We are thankful to Department of Genetic Engineering and Biotechnology, University of Rajshahi, Rajshahi 6205, Bangladesh for providing molecular experiments facility.
AUTHORS CONTRIBUTION
RH, AHK and FMAH designed of the experiment. RH performed the wet lab experimentation and analyzed data. RH and MAR contributed to drafting the article. AHK and AR contributed to revising the manuscript. All the authors approved the final version of the manuscript.
CONFLICTS OF INTEREST
There is no conflict of interest among the authors.
References
- [1]Taher D, Solberg S, et al. World vegetable center eggplant collection: origin, composition, seed dissemination and utilization in breeding. Front Plant Sci. 2017;8:1484.
- [2]Khan MMR, Arita T, et al. Development of the functional male sterile line of eggplant utilizing the cytoplasm of solanum kurzii by way of the amphidiploid. Environ Control Biol. 2020;58:79-83.
- [3]Zhang J, Yang J, et al. Genetic diversity analysis and variety identification using SSR and SNP markers in melon. BMC Plant Biol. 2023;23:39.
- [4]Nwosisi S, Dhakal K, et al. Genetic Diversity in Vegetable and Fruit Crops. In: Nandwani D, editor. Genetic Diversity in Horticultural Plants. Cham: Springer International Publishing; 2019. p. 87-125.
- [5]Ilbi H. RAPD markers assisted varietal identification and genetic purity test in pepper, Capsicum annuum. Scientia Hortic. 2003;97:211-8.
- [6]Wang H, Sun H, et al. A PCR-based SNP marker for specific authentication of Korean ginseng (Panax ginseng) cultivar "Chunpoong". Molecular Biol. Rep. 2010;37:1053-7.
- [7]Jo IH, Kim YC, et al. Applications of molecular markers in the discrimination of Panax species and Korean ginseng cultivars (Panax ginseng). J Ginseng Res. 2017;41:444-9.
- [8]Foolad MR. Genome mapping and molecular breeding of tomato. Int J Plant Genomics. 2007;2007:64358.
- [9]Kratochwil CF, Kautt AF, et al. Benefits and limitations of a new genome-based PCR-RFLP genotyping assay (GB-RFLP): A SNP-based detection method for identification of species in extremely young adaptive radiations. Ecol Evol. 2022;12:e8751.
- [10]Niklas A, Olszewska D. Application of the RAPD technique to identify genetic diversity in cultivated forms of Capsicum annuum L. Biotechnologia. 2021;102:209-23.
- [11]Behera TK, Sharma P, et al. Assessment of genetic diversity and species relationships in eggplant (Solanum melongena L.) using STMS markers. Scientia Hortic. 2006;107:352-7.
- [12]Asad HA, Meah MB, et al. Study of genetic variation of eggplant cultivars by using RAPD-PCR molecular markers and the relationship with Phomopsis blight disease reaction. Genetics and molecular research : GMR. 2015;14:17007-18.
- [13]Shelton AM, Hossain MJ, et al. Bt brinjal in Bangladesh: The First genetically engineered food crop in a developing country. Cold Spring Harb Perspect Biol. 2019;11.
- [14]Hoagland DR, Arnon DI. The water-culture method for growing plants without soil. Circular Cali Agric Exp Stat. 1950;347:32.
- [15]Prokopenko D, Hecker J, et al. Utilizing the Jaccard index to reveal population stratification in sequencing data: a simulation study and an application to the 1000 Genomes Project. Bioinformatics (Oxford, England). 2016;32:1366-72.
- [16]Rohlf FJ. NTSYS-pc: Microcomputer Programs for Numerical Taxonomy and Multivariate Analysis. The American Statistician. 1987;41:330-.
- [17]Comlekcioglu N, Simsek O, et al. Genetic characterization of heat tolerant tomato (Solanum lycopersicon) genotypes by SRAP and RAPD markers. Genet Mol Res. 2010;9:2263-74.
- [18]Carelli BP, Gerald LTS, et al. Genetic Diversity Among Brazilian Cultivars and Landraces of Tomato Lycopersicon Esculentum Mill. Revealed by RAPD Markers. Genet Resour Crop Evol. 2006;53:395-400.
- [19]Baharav TZ, Kamath GM, et al. Spectral Jaccard Similarity: A New Approach to Estimating Pairwise Sequence Alignments. Patterns (New York, NY). 2020;1:100081.
- [20]Bhattarai KP, Louws FJ, et al. Diversity analysis of tomato genotypes based on morphological traits with commercial breeding significance for fresh market production in eastern USA. 2016; Aust J Crop Sci.10:1098-103.
- [21]Gronau I, Moran S. Optimal implementations of UPGMA and other common clustering algorithms. Inf Process Lett. 2007;104:205-10.