Kidney injury molecule-1 and cystatin C as early biomarkers for renal dysfunction in Iraqi type 2 diabetes mellitus patients
Abstract
Diabetic kidney disease (DKD) is caused by a variety of processes. As a result, one biomarker is insufficient to represent the complete process. This study evaluated the diagnostic value of serum kidney injury molecule-1(KIM-1) and cystatin C (CysC) as early biochemical markers of DKD and predicted their sensitivities and specificities as biomarkers of nephropathy in Iraqi type 2 diabetic (T2DM) patients. This cross-sectional study includes 161 T2DM patients. Patients were divided according to urinary albumin creatinine ratio (ACR) such as group1: ACR≤ 30mg/g and group2: ACR> 30mg/g. Random spot urine and fasting blood samples were taken from each patient. Urinary ACR, blood glycated hemoglobin (HbA1c), and serum glucose, creatinine (SCr), lipid profile, CysC, and KIM-1 were assayed, and the estimated glomerular filtration rat (eGFR) was calculated. When compared to the normoalbuminuric group, the DKD group had significantly greater prevalence of retinopathy, and significantly elevated HbA1c and total cholesterol values. Also, DKD group had significantly greater serum levels of KIM-1 and CysC, and there was a significant positive correlation between them. In contrast, GFR was significantly higher in normoalbuminuric group and was significantly negatively correlated with both CysC and KIM-1. Multiple linear regression analysis found that there were a significant positive association among CysC and ACR. Receiver operating characteristic (ROC) analysis revealed that eGFR had the highest area under the curve (AUC=0.717), while SCr had the lowest AUC (0.556). In conclusion, serum KIM-1 and CysC levels could be considered as early biomarker for DKD along with eGFR. Additionally, there was a strong correlation between serum CysC and KIM-1 as well as other renal measures that indicate deteriorating kidney function.
INTRODUCTION
Diabetes is a collection of metabolic illnesses defined by elevated blood glucose levels that result from abnormalities in insulin secretion, action, or both [1]. Diabetic nephropathy (DN), also known as diabetic kidney disease (DKD) is a micro-vascular complication of diabetes that is a leading cause of end-stage renal disease (ESRD), which has high morbidity and mortality rates [2], and is characterized by the progressive decline of renal function [3]. Approximately, 20–50% of patients with type 2 diabetic patients (T2DM) ultimately develops DKD [4]. The primary causes of kidney disease development in DKD are glomerulocapillary angiopathy and a long duration of diabetes, both of which are major sources of morbidity and death in T2DM [5]. The measurement and monitoring of renal function have historically been based on proteinuria, which has long been regarded as the gold standard [6]. The urine albumin-creatinine ratio (ACR) and estimated glomerular filtration rate (eGFR) are the current two indicators utilized to diagnose DKD [7]. Several investigations on the ACR value have shown that not every DKD patient had elevated levels in the early phases of the disease, indicating that the value of ACR is insufficiently sensitive to serve as an indicator for the early stages of DKD [8, 9]. Whereas calculating eGFR using serum creatinine (SCr) can only be verified when the eGFR value < 60 mL/min/1.73 m2, at which point approximately fifty percent of the renal function has already been lost [10]. Thus, in order to reliably predict DKD in the early stages, a more sensitive as well as specific biomarker than the two presently utilized is required.
Since DKD develops through multiple mechanisms, only one biomarker is insufficient to explain the whole mechanism. Instead, a biomarker panel comprised of numerous peptides and proteins is thought to be more reflective of diverse disease progression pathways [11]. Cystatin C (CysC), a low-molecular-weight (13.3 kDa) protein that has been continuously produced by all nucleated cells, freely filtered by the glomerulus, and completely metabolized by the proximal tubule [12], is being investigated as a new endogenous serum biomarker that is sensitive for the early evaluation of changes in eGFR as a filtration marker. Most studies demonstrate that serum CysC levels are more closely connected to eGFR than SCr [13, 14]. Serum CysC concentrations have also been proven to be unaffected by some inflammatory diseases or metabolic abnormalities. Since CysC is independent of several characteristics that impact SCr such as age, race, gender, and muscle mass, an equation based on CysC may be more precise in diagnosing renal disease in the elderly, children, and those with muscle composition disorders [15]. Furthermore, when eGFR remains over 60 mL/min, CysC levels serve as a more precise predictor of early DN and also connect with DN progression [16]. The chronic kidney disease epidemiology collaboration (CKD-EPI) consortium developed and verified a new eGFR equations based on SCr alone and in conjunction with CysC (eGFRcr-cys) in 2021 which solely took into account with age and gender. The incorporation of SCr and CysC biomarkers in GFR estimate equations has been found to increase accuracy and diminish the influence of ethnicity as a predictor [17].
A type I transmembrane glycoprotein known as kidney injury molecule-1 (KIM-1) is abundantly produced at the apical membranes of proximal epithelial cells in tubules during regeneration of tissue following toxic or ischemic acute kidney injury, and additionally when tubular epithelial cells are dedifferentiated [18]. Tubulo-interstitial damage, which includes complicated structural changes such as glomerular and tubular hypertrophy, is associated with all forms of CKD, including DN [19]. Due to the presence of various tubular proteins and enzymes even prior to the onset of microalbuminuria and an increase in SCr, it has been demonstrated that tubular involvement occurs before glomerular involvement [20]. In a study, blood KIM-1 levels were drastically raised during acute kidney injury and CKD, suggesting that KIM-1 might be used as an indicator of renal damage. The main hypothesis was that KIM-1 circulates because tubular cell polarity is lost and transepithelial permeability is enhanced after injury to the tubule [21]. No previous study about KIM-1 as early biomarkers of DKD in Iraqi T2DM patients was reported.
The purpose of this study was to assess the diagnostic value of serum CysC and KIM-1 as early biochemical markers of DKD and predict their sensitivities and specificities as biomarkers of nephropathy in Iraqi T2DM patients.
MATERIALS AND METHODS
Study design, sample, and data collection
A cross-sectional study was conducted at the Diabetes and Endocrinology Center at Merjan Medical City in Babylon. The study was carried out on 161 already-diagnosed T2DM patients collected from March 2022 to January 2023 during their visit to the center. The study included two groups divided according to DKD state based on urinary ACR (Group 1: ACR 30 mg/g, Group 2: ACR > 30 mg/g).
Ethical statement
Verbal informed consents from patients before specimen collections were taken. Also, the research protocol, the subject information, and the permission form were reviewed and approved by the local ethical committee from the Diabetes and Endocrinology Center as well as the Research Unit of the Center for Training and Human Development of the Babylon Health Directorate in Babylon province on March 8, 2022, according to document number 36.
Inclusion criteria
- Already diagnosed T2DM patients who are aged over 40 years of either sex or who are accepted to participate in the study.
- T2DM patients with DM duration 5 years with or without DKD.
Exclusion criteria
- History of renal disease before the onset of diabetes.
- Patients with severe uncontrolled hypertension (>160/100 mm Hg).
- Presence of any sign or symptom of inflammatory renal disease or autoimmune disease.
- Patients suffering from drug-induced nephrotoxicity or secondary causes of albuminuria such as renal stone disease, obstructive renal disease, or acute urinary tract infection (UTI).
- Alcoholic patients.
Analysis of urinary albumin, creatinine, and calculation of ACR
A random spot urine sample was taken from each patient, and part of it was taken for general urine examination to exclude patients who had UTI. From the other part of the urine sample, 1 ml was taken and diluted to 20 ml with distilled water to assess urine creatinine kinetically at 490 nm using a colorimetric reaction (Jaffe reaction) of creatinine with alkaline picrate (Biolab, France, Standard reference material ®), where 100 μL of diluted urine was taken and added to reagents and read absorbance at 490 nm twice, the first reading after 30 seconds and the second reading after 2 minutes, and then the calculation was done as follow:
Thus, result =
Where, standard concentration was 177 μmol/L (2 mg/dL).
The remaining urine was then centrifuged at 4000 rpm for 10 minutes for the measurement of urine albumin by the Abnova BCG Albumin kit which was designed to measure albumin directly in biological samples without any pretreatment. The improved method utilized bromocresol which particularly produces a colored complex specifically with albumin. The intensity of the color, measured at 620 nm, is directly proportional to the albumin concentration in the sample. And to define urine albumin values, standard curve was plotted (Bcg albumin assay kit, Abnova). Then ACR (mg/g) was calculated as the ratio of urine albumin in mg/L to urine creatinine in g/L [22].
Measurement of blood parameters
5 ml of venous blood was withdrawn from each patient after overnight fasting. Then, 1 ml of blood was placed in an EDTA tube for complete blood count (CBC) testing using (Mythic Autoanalyzer) a fully automated hematology analyzer to measure hemoglobin (Hb), and detection of HbA1c was performed directly by using Cobas e411 apparatus. Further, 4 ml of blood was placed in a gel tube for obtaining serum for measurement of fasting blood glucose (FBG), creatinine, and lipid profile using a fully automated Kromo Linear apparatus by the staff in Diabetic and Endocrinology center. Also, 1 ml of serum was stored in two separate eppendorf tubes at -80oC until the time for testing serum CysC and KIM-1 by ELISA technique (BT laboratory/China kit) which are plate-based assays for detecting and quantifying a specific protein in a complex mixture. Briefly, the plate was pre-coated with Human CST3 antibody for CysC detection and Human HAVCR1 antibody for KIM-1 detection. The target protein present in the sample is added and binds to antibodies coated on the wells. And then biotinylated Human CST3 or HAVCR1 antibody was added and bound to target protein in the sample. Then Streptavidin-HRP was added and bound to the Biotinylated antibody. After incubation unbound Streptavidin-HRP was washed away during a washing step. Substrate solution was then added, and color developed in proportion to the amount of human protein in the sample. The reaction was terminated by addition of acidic stop solution and absorbance was measured at 450 nm. To define CysC or KIM-1 values, standard curve was plotted (ELISA kit, 501 changsheng s rd, nanhu dist, jiaxing, zhejiang, china). The eGFR was calculated using the CKD-EPI Creatinine-Cystatin Equation (2021) online calculator [23].
Statistical analysis
The data was analyzed using statistical package version 26 of the Social Sciences (SPSS) program. All of the study items were subjected to descriptive statistics. Means and standard deviations (SD) were used for expressing continuous variables, whereas categorical variables were represented using frequencies and percentages. An independent T-test was used to assess the differences in the means of continuous parameters between the two study groups: normoalbuminuric T2DM and DKD in T2DM. The categorical variables' differences between the two study groups were evaluated using chi-square. Multiple linear regression analysis was used to measure the association between ACR (the outcome variable) and seven parameters (independent variables): age, body mass index (BMI), DM duration, HbA1c, KIM-1, CysC, and eGFR. Receiver operating characteristic (ROC) curve analysis were used to measure area under the curve (AUC), specificity, and selectivity of 4 tests of DKD: KIM-1, CysC, SCr, and eGFR. A p value < 0.05 was considered statistically significant. GraphPad Prism 7.04 was used to develop the figures.
RESULTS
Demographic characteristics and biochemical markers of the study groups
The variations in individual characteristics and biochemical indicators between the studied groups suggest that both study groups had comparable age, BMI, blood pressure (BP), and diabetes duration. In terms of biochemical markers, DKD patients exhibited significantly higher levels of HbA1c and total cholesterol (TC) (P <0.05) than the normoalbuminuric group, while other biomarkers (FBG, Hb, TG, HDL) were not significantly differ between the study groups (Table 1).
For categorical variables and according to Pearson Chi-Square, women had a significantly (P <0.05) higher prevalence of DKD than men. When compared to the normoalbuminuric group, the DKD group had a significantly (P <0.05) higher prevalence of retinopathy, while smoking status, living location, and chronic heart disease (CHD) did not differ significantly across study groups (Table 2).
Table 1. The difference in the means of patient parameters according to the existence of DKD.
Table 2. The association between patient categorical characteristics in DKD.
Comparison of kidney-related parameters and correlation with other parameters
Results of kidney-related measures showed that two urinary markers (ACR and urine albumin) and two biochemical markers (KIM-1 and CysC) were significantly higher in patients with DKD compared to the normoalbuminuric group. In contrast, urine creatinine and eGFR were significantly higher in the normoalbuminuric group compared to the DKD group, while SCr was higher in DKD, though the difference was not significant (Table 3 and Figures 1-3).
There were two significant correlations between patient age and renal parameters: a positive correlation with SCr and a negative correlation with eGFR. There were no significant correlations between BMI, DM duration, HbA1c, TG, and HDL and renal parameters. For SCr which had significant negative (P value < 0.05, P value < 0.01) correlations with both TC and eGFR, respectively. Furthermore, there was a significant (P value < 0.01) positive correlation between KIM-1 and CysC. Finally, eGFR had significantly negative (P value < 0.01) correlations with all renal parameters (Table 4).
When using multiple linear regression analysis, there were significant positive associations between CysC and ACR after controlling other variables. On the other hand, other parameters (age, BMI, DM duration, HbA1c, KIM-1, TC, and eGFR) had non-significant associations with the outcome variable (ACR) (Table 5).
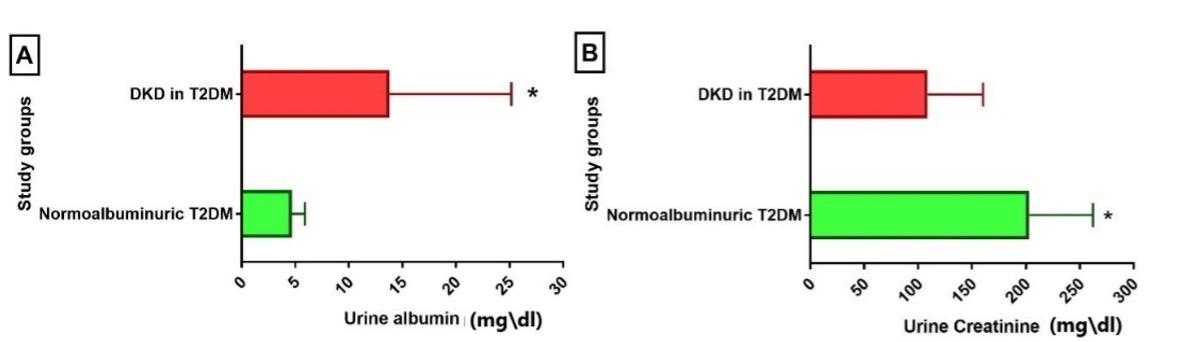
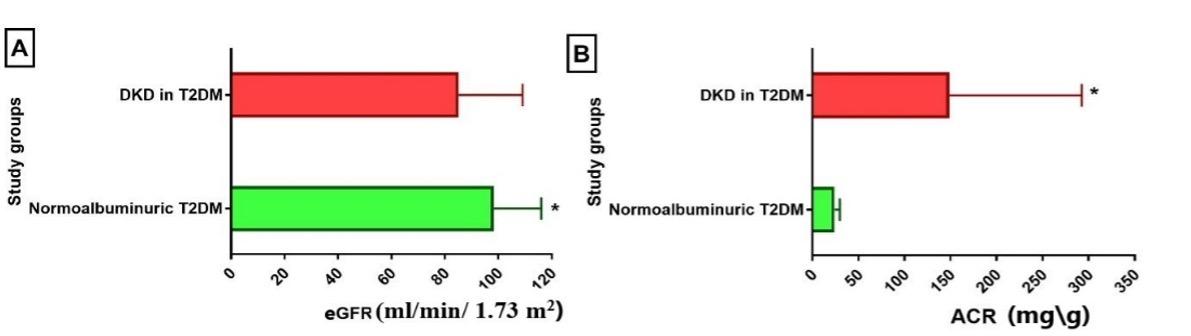
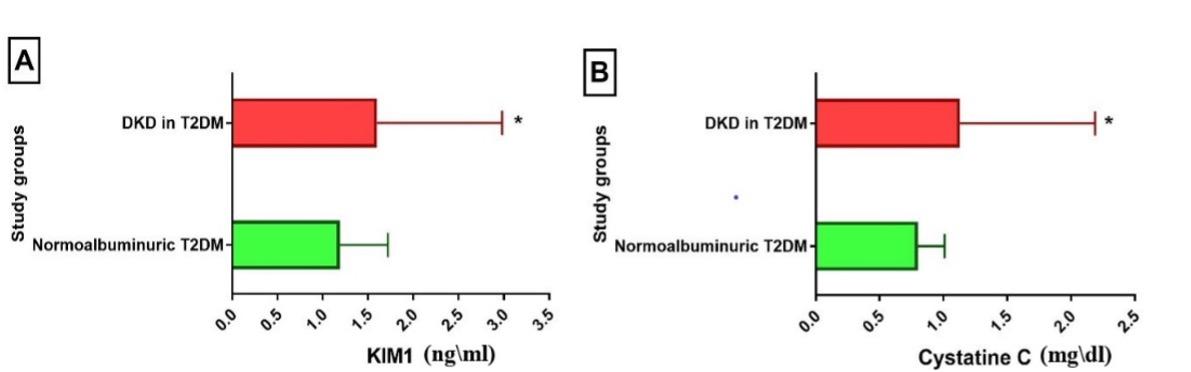
Table 3. Kidney-related parameters in DKD patients.
Table 4. The correlations among patient characteristics and measured parameters.
Table 5. Association between patient characteristics and biomedical parameters with ACR levels.
Receiver operating characteristic (ROC) curve analysis
According to receiver operating characteristic (ROC) curve analysis, the area under the curve (AUC) for GFR was the highest (AUC = 0.717), whereas SCr had the lowest (AUC = 0.556) as shown in (Table 6). Regarding the diagnostic accuracy of DKD, in other words, eGFR is helpful as the best diagnostic test; CysC and KIM-1 (AUC = 0.619-0.652) are good tests; and SCr is a poor diagnostic test for DKD. Similarly, eGFR has acceptable sensitivity (0.724) and specificity (0.627), while the other three tests (CysC, KIM-1, and SCr) have inadequate diagnostic selectivity and specificity (Table 7 and Figures 4 and 5). The cutoff level for the eGFR was 95 ml/min/ 1.73 m2, and any value below this level indicates DKD (Table 7).
Table 6. Area under the curve (AUC) of kidney-related parameters: CysC, KIM-1, SCr, eGFR.
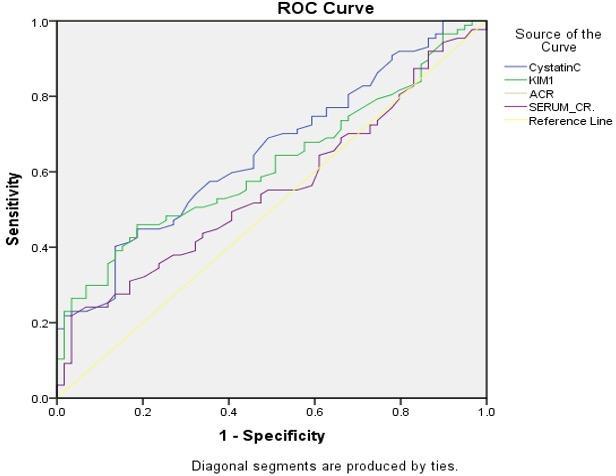
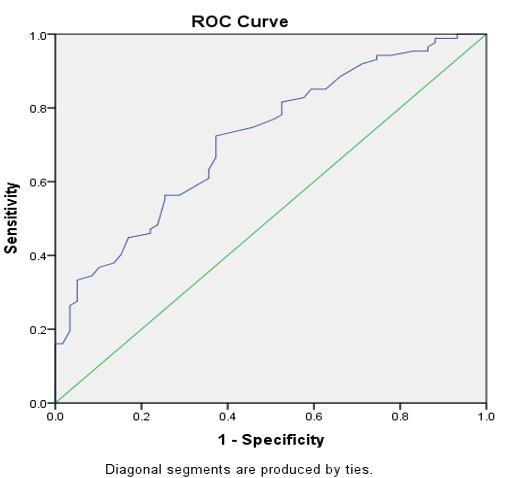
Table 7. Analysis of the ROC curve: sensitivity and specificity of CysC, KIM-1, SCr, eGFR.
DISCUSSION
Diabetic kidney disease is thought to be a result of a combination of environmental and medical conditions, including persistent hyperglycemia, dyslipidemia, and/or arterial hypertension in genetically susceptible individuals [24]. The current study revealed that both patient groups (with or without DKD) had an approximate mean age occurring in the sixth century and an approximate BMI, indicating that most patients were overweight. Also, both study groups had normal SBP and DBP with no significant difference between study groups; these findings were in agreement with a previous study [2]. Females had a higher prevalence than males in DKD, and this result is similar to that of an Iraqi study [25]. The duration of DM and presence of CHD, in addition to smoking status and living place results, showed no significant differences between the studied groups.
Both study groups had poor glycemic control with FBG levels above 10 mmol/l and uncontrolled HbA1c levels that were significantly higher for DKD patients; also, DKD patients had significantly higher TC. Previous studies on T2DM with DKD showed significant differences in FBG and HbA1c between normalbuminuria, microalbuminuria, and macroalbuminuria in T2DM patients [24, 26-29]. In terms of lipid profile, a previous study results were similar to the present study results, which showed significant differences in TC but no significant difference in both TG and HDL between patient groups (with and without DKD) [24].
For kidney-related measures, there were significant differences in all studied urinary parameters (albumin, creatinine, and ACR) between the study groups, while SCr was higher in the DKD group but not significant. Numerous studies results were in accordance with the present study regarding urinary albumin, creatinine, and ACR, except for SCr, for which the difference was significant in these studies [2, 6, 19, 27, 30-33]. Several studies found no significant difference in SCr [34, 35], which was in accordance with the present findings. Because tubular proteins and enzymes such as KIM-1, N-acetyl-d-glucosaminidase, and 2-microglobulin are detectable even before the onset of microalbuminuria and an increase in SCr, it has been demonstrated that tubular involvement occurs prior to glomerular involvement in DKD [20, 36]. As a result, tubular biomarkers may be as significant as glomerular markers in detecting renal impairment early in T2DM. Urine albumin excretion and GFR are commonly used to diagnose and monitor DN. While the GFR estimate represents late functional abnormalities rather than early structural issues in the kidney and is creatinine-based, it is impacted by a range of characteristics such as ethnicity, muscle mass, age, and gender [16]. Several indicators in blood and urine have been recently examined which serve an essential role as early identifying indicators of acute renal injury and its consequences, such as CysC and KIM-1 [30]. The current study found that serum KIM-1 levels are considerably higher in the DKD group; these findings were in accordance with earlier research findings [31, 32]. Previous meta-analysis done on urinary KIM-1 (uKIM-1) also showed significant differences with higher levels in DKD groups, indicating that uKIM-1 was a sensitive and specific marker for early detection of DKD in patients with T2DM [37].
Serum CysC worked well as an acute kidney failure marker and was considered to diagnose acute kidney failure development earlier than SCr [38]. In this study, CysC levels were significantly higher in DKD patients compared to the normoalbuminuric group, which was consistent with previous findings that found serum CysC higher in both microalbuminuria and macroalbuminuria compared to normalbuminuria [27-29, 39].
In this study, there were significant correlations between age and both SCr levels and eGFR; as age increased, SCr increased, while eGFR decreased as age increased. Also, SCr had a significant negative correlation with TC and eGFR. These results were in accordance with previous results except for TC [40, 41]. Moreover, the current study found a considerable positive correlation between serum CysC and KIM-1 and a strong negative correlation with eGFR; therefore, eGFR decreased significantly as SCr, CysC, and KIM-1 increased. Recently Iraqi study found significant negative correlation between serum CysC and eGFR in both microalbuminuria and macroalbuminuria patients [39]. A study found that there was a substantial negative relationship between serum CysC and eGFR. Serum CysC and SCr also had a substantial positive connection. However, there was no significant relationship between serum CysC and age [29]. While another study demonstrates a positive association between serum CysC and ACR. Furthermore, serum CysC was shown to be positively associated with age and duration of diabetes [41].
Multiple linear regression analyses show significant positive associations between CysC, and ACR. These results were consistent with previous studies [42-44], which found that CysC levels were shown to have a significant correlation with albuminuria. As a result, it might be used as an early warning sign of microalbuminuria in the detection of nephropathy [42-44]. Regarding KIM-1, the current study's findings were not significant (p=0.050) while a study found that both urine and serum KIM-1 levels are highly significant associated with albuminuria than eGFR. Because long-term albuminuria causes proximal damage in those with classic DN and is followed by GFR loss from interstitial injury, it implies long-term renal impairment. Serum KIM-1 may also represent interstitial damage caused by proximal tubular injury [31].
The area under a ROC curve assesses the statistics' capacity to accurately differentiate between individuals with abnormal albuminuria and those with normal albuminuria. The ACR was used to categorize patients. The optimum test for illness diagnosis is one that has 100% sensitivity and specificity. Nonetheless, the ROC curve is designed to compare the greatest sensitivity and highest specificity by adjusting sensitivity and specificity [30]. In the present study, eGFR had the best ROC result compared to other serum markers, so it can be considered the best diagnostic test to differentiate DKD from normalbuminuric T2DM, these result was consistent with Al-Saedy et al. which found approximate cutoff level with lower specificity and higher sensitivity, however (AUC=0.616) was nonsignificant and lower than that of the present study [30]. Also, serum CysC had a higher AUC, sensitivity, and specificity compared to other serum markers, followed by serum KIM-1 and SCr, which had the least AUC, sensitivity, and specificity. These results were consistent with Iraqi study by Al-Saedy et al. which found AUC for CysC was 0.706 (p < 0.005) [30], and also with two recent studies which identify that the AUC of serum CysC was 0.617 (p < 0.005) for predicting DKD [41, 45]. While other recent Iraqi study found that serum CysC had higher sensitivity and specificity with higher AUC especially in macroalbuminuria patients [39], also other prior studies show a higher AUC for CysC [27, 46, 47]. It could be due to the small sample size and the use of ACR rather than GFR levels to group patients.
The main limitation of the present study is that its design was cross-sectional, and the serum and urine variables were only examined once for each patient, which may have overestimated or underestimated the results. This limits the diagnostic role for progressive DKD, which necessitates a prospective study. Furthermore, the gold standard approach of GFR evaluation and 24-hour urinary albumin excretion rate were not examined since this study used random spot urine for ACR calculation rather than 24-hour urine collections, which were unable to perform for all patients.
CONCLUSION
The current investigation presents clinical evidence that serum KIM-1 and CysC levels might be considered early biomarkers for DKD, along with eGFR, which have the best sensitivity and specificity for the diagnosis of DKD compared to other serum biomarkers.
ACKNOWLEDGEMENT
The authors would like to thank all participants in this study. This study received no external financial support.
AUTHOR CONTRIBUTIONS
The work was designed, supervised, and performed by AAY, DJK, and NAA. AAY and DJK wrote this manuscript's initial draft. Sample collection and data gathering by AAY and NAA. AAY analyzed and interpreted the data. All authors reviewed and approved the final article.
CONFLICTS OF INTEREST
There is no conflict of interest among the authors.
References
- [1]Faiq MK, Saleh ES, et al. Influence of the high mobility group a1 genetic polymorphism on indices of metabolic syndrome and insulin resistance in the iraqi population: Case-control study. J Adv Biotechnol Exp Ther. 2023; 6(2): 326-336.
- [2]Ahmed MH, Haddad NI, et al. Correlation between albuminuria levels and chitinase 3 like 1 protein in iraqi patients with type 2 diabetes mellitus. Iraqi Journal of Science. 2022:21-32.
- [3]Darraji M, Saqban L, et al. Association of candidate genes polymorphisms in iraqi patients with chronic kidney disease. Journal of Advanced Biotechnology and Experimental Therapeutics. 2022;6:687.
- [4]Hoogeveen EK. The epidemiology of diabetic kidney disease. Kidney and Dialysis. 2022;2:433-42
- [5]A. Mezil S, Ghudhaib K, et al. Evaluation of serum pentraxin3 level in Iraqi patients with diabetic nephropathy. Biochemical and Cellular Archives. 2018;18:pp. 2473-7
- [6]DyabAllawi AA, Nada SZ, et al. Neutrophil gelatinase associated lipocalin (ngal) in early detection of nephropathy in type 2 diabetic iraqi patients. Journal of the Faculty of Medicine Baghdad. 2017;59:74-8.
- [7]Colhoun HM, Marcovecchio ML. Biomarkers of diabetic kidney disease. Diabetologia. 2018;61:996-1011.
- [8]Said SM, Nasr SH. Silent diabetic nephropathy. Kidney international. 2016;90:24-6.
- [9]Sauriasari R, Safitri DD, et al. Current updates on protein as biomarkers for diabetic kidney disease: A systematic review. Therapeutic advances in endocrinology and metabolism. 2021;12:20420188211049612
- [10]Bjornstad P, Cherney DZ, et al. Update on estimation of kidney function in diabetic kidney disease. Current diabetes reports. 2015;15:1-12.
- [11]Pena MJ, Mischak H, et al. Proteomics for prediction of disease progression and response to therapy in diabetic kidney disease. Diabetologia. 2016;59:1819-31.
- [12]Shaimaa SM. Cystatin-c marker in diabetic and non diabetic patients with ischemic heart disease Journal of the Faculty of Medicine 2012;54:176-8.
- [13]Mussap M, Dalla Vestra M, et al. Cystatin c is a more sensitive marker than creatinine for the estimation of gfr in type 2 diabetic patients. Kidney international. 2002;61:1453-61.
- [14]Roos JF, Doust J, et al. Diagnostic accuracy of cystatin c compared to serum creatinine for the estimation of renal dysfunction in adults and children—a meta-analysis. Clinical biochemistry. 2007;40:383-91.
- [15]Ferguson TW, Komenda P, et al. Cystatin c as a biomarker for estimating glomerular filtration rate. Current Opinion in Nephrology and Hypertension. 2015;24:295-300.
- [16]Currie G, McKay G, et al. Biomarkers in diabetic nephropathy: Present and future. World journal of Diabetes. 2014;5:763.
- [17]Teo BW, Xu H, et al. Estimating glomerular filtration rates by use of both cystatin c and standardized serum creatinine avoids ethnicity coefficients in asian patients with chronic kidney disease. Clinical chemistry. 2012;58:450-7.
- [18]Yang L, Brooks CR, et al. Kim-1–mediated phagocytosis reduces acute injury to the kidney. The Journal of clinical investigation. 2015;125:1620-36.
- [19]El-Attar H, Khalil G, et al. Human kidney injury molecule-1 (kim-1) level as an early marker for diabetic nephropathy in egyptian type 2 diabetic patients. Journal of Renal Medicine. 2017;1:1-13.
- [20]Chaudhary K, Phadke G, et al. The emerging role of biomarkers in diabetic and hypertensive chronic kidney disease. Current diabetes reports. 2010;10:37-42.
- [21]Sabbisetti VS, Waikar SS, et al. Blood kidney injury molecule-1 is a biomarker of acute and chronic kidney injury and predicts progression to esrd in type i diabetes. Journal of the American Society of Nephrology. 2014;25:2177-86
- [22]Hamid GS, Allawi AA, et al. Correlation of pentosidine with kidney diseases in iraqi patients with diabetic nephropathy. Iraqi Journal of Science. 2021:3436-42
- [23]Inker LA, Eneanya ND, et al. New creatinine-and cystatin c–based equations to estimate gfr without race. New England Journal of Medicine. 2021;385:1737-49.
- [24]Osman WM, Jelinek HF, et al. Clinical and genetic associations of renal function and diabetic kidney disease in the united arab emirates: A cross-sectional study. BMJ open. 2018;8:e020759.
- [25]Naif NH, Nada SZ, et al. Association between insulin resistance and enos activity in type 2 diabetic iraqi patients with nephropathy. Sci. J. Med. Res. 2021;5(19):54-58.
- [26]Kedam DP, Polur H, et al. Cystatin-c as a biomarker in predicting early renal impairment in normo-albuminuric patients with type 2 diabetes mellitus. Journal of pharmaceutical sciences and research. 2015;7:913.
- [27]Jeon YK, Kim MR, et al. Cystatin c as an early biomarker of nephropathy in patients with type 2 diabetes. Journal of Korean medical science. 2011;26:258-63.
- [28]Lee B-W, Ihm S-H, et al. The comparison of cystatin c and creatinine as an accurate serum marker in the prediction of type 2 diabetic nephropathy. Diabetes research and clinical practice. 2007;78:428-34.
- [29]Elsayed MS, El Badawy A, et al. Serum cystatin c as an indicator for early detection of diabetic nephropathy in type 2 diabetes mellitus. Diabetes & Metabolic Syndrome: Clinical Research & Reviews. 2019;13:374-81.
- [30]Al-Saedy AAK, Turki KM, et al. Effect of serum cystatin c in early diabetic nephropathy in type 2 iraqi diabetic patients. J Contemp Med Sci. 2017;3:208-12.
- [31]Gohda T, Kamei N, et al. Circulating kidney injury molecule‐1 as a biomarker of renal parameters in diabetic kidney disease. Journal of diabetes investigation. 2020;11:435-40.
- [32]Khan FA, Fatima SS, et al. Evaluation of kidney injury molecule-1 as a disease progression biomarker in diabetic nephropathy. Pakistan journal of medical sciences. 2019;35:992.
- [33]Mohamed AaH, Zaidan HK, et al. Study the possible levels of inflammatory marker tnf-α and microalbuminuria in type 2 diabetic nephropathy patients of babylon province/iraq. Medico-legal Update. 2021;21.
- [34]Hu F, Zhang T. Study on risk factors of diabetic nephropathy in obese patients with type 2 diabetes mellitus. International Journal of General Medicine. 2020:351-60.
- [35]Salman Jasim H, Farooq Altaie A, et al. Comparative study of new biomarkers in iraqi dm2 with and without complications. Reports of biochemistry & molecular biology. 2022;11:400-4.
- [36]Rees AJ, Kain R. Kim-1/tim-1: From biomarker to therapeutic target? Nephrology Dialysis Transplantation. 2008;23:3394-6.
- [37]Kapoula GV, Kontou PI, et al. Diagnostic performance of biomarkers urinary kim-1 and ykl-40 for early diabetic nephropathy, in patients with type 2 diabetes: A systematic review and meta-analysis. Diagnostics (Basel, Switzerland). 2020;10.
- [38]Sit D, Basturk T, et al. Evaluation of the serum cystatin c values in prediction of indications for hemodialysis in patients with chronic renal failure. International urology and nephrology. 2014;46:57-62.
- [39]Taher AY, Alsodani MH, et al. Assessment of correlation between serum βtp and cystatin c as biomarkers for the detection of early nephropathy in iraqi patients with type 2 diabetes. diabetes.6:7774-84.
- [40]Asmamaw T, Genet S, et al. Early detection of renal impairment among patients with type 2 diabetes mellitus through evaluation of serum cystatin c in comparison with serum creatinine levels: A cross-sectional study. Diabetes, metabolic syndrome and obesity : targets and therapy. 2020;13:4727-35.
- [41]Sapkota S, Khatiwada S, et al. Diagnostic accuracy of serum cystatin c for early recognition of nephropathy in type 2 diabetes mellitus. International Journal of Nephrology. 2021;2021.
- [42]Gupta K, Nayyar S, et al. Cystatin c in the early diagnosis of diabetic nephropathy and its correlation with albuminuria. International Journal of Advances in Medicine. 2017;4:56-9.
- [43]Arceo ES, Dizon GA, et al. Serum cystatin c as an early marker of nephropathy among type 2 diabetics: A meta-analysis. Diabetes & Metabolic Syndrome: Clinical Research & Reviews. 2019;13:3093-7.
- [44]Amelia R, Sari DK, et al. Correlation of cystatin-c with albumin creatinine ratio for the diagnosis of diabetic nephropathy in patients with type 2 diabetes: A cross-sectional study in medan indonesia. Open Access Macedonian Journal of Medical Sciences. 2022;10:12-5.
- [45]Taha MM, Mahdy-Abdallah H, et al. Diagnostic efficacy of cystatin-c in association with different ace genes predicting renal insufficiency in t2dm. Scientific Reports. 2023;13:5288.
- [46]Qamar A, Hayat A, et al. Serum cystatin c as an early diagnostic biomarker of diabetic kidney disease in type 2 diabetic patients. Journal of the College of Physicians and Surgeons Pakistan. 2018;28:288-92.
- [47]Liao X, Zhu Y, et al. Diagnostic value of serum cystatin c for diabetic nephropathy: A meta-analysis. BMC Endocrine Disorders. 2022;22:1-12.