Effects of glycyrrhizin, stevioside, and sucralose on the growth and metabolism of the omnipresent gut commensal Escherichia coli
Abstract
The rise in popularity of non-caloric sweeteners (NCS) among obese and diabetic patients is due to their ability to provide a sweet taste without any caloric input. However, NCS consumption may be linked to metabolic disorders. The mechanisms behind these adverse effects are still unclear, which suggests that NCS may alter the metabolic activity of the gut microbiome, leading to enteric environmental perturbation and resulting in physiological anomalies in the host. This study investigates how Escherichia coli, a common gut microbe, reacts to three NCS, two of which come from nature (glycyrrhizin and stevioside) and one that is made artificially (sucralose). To assess the impact of these NCS, this study investigated the growth, gene expression, and metabolic pathways of E. coli under different sweetener loads. Compared to the untreated control, low amounts of glycyrrhizin made E. coli grow faster, while similar amounts of sucralose and stevioside had no or a less noticeable effect. At higher concentrations, these sweeteners slowed down or inhibited the growth of the bacteria. Thus, NCS may have dose-dependent impacts on gut microbes. After treatment with amounts that corresponded to the acceptable daily intake, the expression of key metabolic genes showed altered expression, which may potentially affect their metabolism. At different concentrations of the NCS, there were clear differences in the global metabolomic profile between the control and the different NCS treatments. Under in vitro conditions, glycyrrhizin and sucralose appeared to have a less divergent impact on E. coli growth, gene expression, and metabolism, which may suggest that these are relatively safer sugar substitutes for humans.
INTRODUCTION
The consumption of sugars, primarily in the form of sucrose and glucose-fructose syrups, has increased dramatically on a global scale due to the increased abundance of processed food. Sugar consumption is often being reduced due to growing concerns about the negative impact of sugars on conditions such as type 2 diabetes mellitus (T2DM), obesity, cardiovascular complications, and metabolic syndrome [1]. Non-caloric sweeteners (NCS) offer a possible solution to these issues, as these offer sweetness without contributing significant calories. By substituting NCS for sugar, individuals can reduce their caloric intake and lessen their chance of developing weight-related health issues such as obesity and T2D. Also, the wide availability of NCS in a variety of food and beverage products has made these a convenient option for people willing to reduce their sugar intake without having to make significant changes to their diet [2]. Two popular NCS from natural sources are licorice (liquorice) and stevia. A popular NCS produced by artificial synthesis is sucralose. Natural sweeteners are a fairly new addition to the range of non-caloric sweeteners, but these are quickly gaining popularity. Licorice is obtained from the flowering plant Glycyrrhiza glabra, a member of the bean family Fabaceae, whose sweet-tasting root possesses an aromatic flavor [3]. Glycyrrhizin is the principal sweet-tasting component of licorice. It is 33 times sweeter than sucrose [4]. In accordance with the Joint FAO/WHO Expert Committee on Food Additives (JECFA), taking more glycyrrhizic acid (GA) than 100 mg/day could have negative effects on adults, leading to secondary diseases such as hypertension and hypokalemia [3]. Stevia, a natural non-caloric sweetener (NNCS), is a glycoside derived from Stevia rebaudiana Bertoni, a native South American shrub of the sunflower family Ateracea [5], and is 300 times sweeter than sucrose [6]. Commercially available steviol glycoside combinations contain two principal active ingredients: stevioside and rebaudioside A, of which stevioside comprises 10–70% of the total amount [7]. These two ingredients differ in the R group (a hydroxyl group in stevioside and/or glucose in rebaudioside A) [2]. In 2008, the FDA (USA) classified steviol glycosides as "generally recognized as safe (GRAS)" with an acceptable daily intake (ADI) limit of 4 mg per kg of body weight per day [2]. Sucralose belongs to the artificial or synthetic category of non-caloric sweeteners and is synthesized by selectively substituting three hydroxyl groups on the sucrose core in the C1, C4, and C6 positions by three chlorine atoms by chlorination process, producing a disaccharide named 1,6-dichloro-1,6-dideoxyfructose–4-chloro-4-deoxygalactose. It is 600 times sweeter than sucrose [4]. The ADI for sucralose, as determined by the FDA, is 5 mg per kg of body weight per day [8].
Although regulatory bodies like the European Food Safety Authority (EFSA) and the FDA (USA) typically deem NCS safe for eating, mounting data points to the unexpected health effects of NCS on humans. NCS consumption has been linked to increased weight gain, glucose intolerance, increased hunger, and altered taste sensitivity in rodents and humans [9,10]. A study on a mouse model suggests that exposure to non-caloric sweeteners may impair glucose metabolism by altering the microbiome in stomach, which might lead to obesity and T2D [5]. Although the NCS were once thought to be metabolically inert within the host GI tract and thus considered safe, recent findings have raised concerns [11].
The digestive tract of humans contains trillions of microorganisms, and these gut microflorae play a crucial role in metabolic health and diseases. As the NCS travel through the GI tract of the host, these can interact directly with the intestinal microbiota to change the gut microbiome and function [12]. NCS might also change the environment surrounding the gut microflora, altering their growth and metabolism [5,13].
One of the first gut colonists and lifelong cohabitants is E. coli [14]. It is the most common facultative anaerobe in the human digestive tract. It may help reduce the amount of oxygen on the surface of the gastrointestinal mucosa, making it easier for strict anaerobes to colonize and take over [14]. A change in the number of gut E. coli is linked to numerous disorders. Its increasing abundance is linked to T2D [15], Hashimoto's thyroiditis [16], cystic fibrosis [17], inflammatory bowel diseases [18], diabetic kidney diseases [19], Crohn's disease [20], atherosclerosis [21], asthma [22], and other conditions. Infection with Helicobacter pylori is connected with a decline in the population of E. coli [23]. Long-term kidney disease can also arise from variations in its abundance, although the specific pattern of these changes is still unknown [24].
The objective of this study was to assess the impact of these NCS by investigating the growth, gene expression, and metabolic pathways of E. coli under different sweetener loads.
MATERIALS AND METHODS
Evaluation of E. coli proliferation in the presence of various NCS concentrations
E. coli K-12 strain was grown in Luria-Bertani (LB) broth at pH 5.0 to the log phase. The stock solutions of the NCS (glycyrrhizin, stevioside, and sucralose) were prepared in LB media at pH 5.0. The stock solutions were filtered through 0.2 µm filters. To assess the influence of the three NCS on bacterial growth, different concentrations of the three sweeteners were supplemented to the LB media, where the log-phase E. coli was inoculated in equal amounts and incubated in 96 well microtiter plates at 37° C and 120 rpm shaking. Two biological replicates, including four technical replicates, were included for all the concentrations of each of the three sweeteners. Blank cultures corresponding to each sweetener concentration were included. Absorbance at 630 nm was measured every 30-minute time with the help of a microplate reader. The average OD of the blank samples was subtracted from the OD of the corresponding sweetener-treated bacterial cultures. The average ± standard deviation of the OD of the cultures at each time interval was used to generate the growth curve. The growth curve of the bacteria was generated using GraphPad Prism 6.
Relative gene expression analysis
LB media (at pH 5.0) supplemented with two concentrations of each of the three NCS was inoculated by equal amounts of log-phase E. coli. The concentrations were: 1.0 mg/ml and 1.8 mg/ml of glycyrrhizin, 1.0 mg/ml and 3.5 mg/ml of stevioside, and 1.0 mg/ml and 3.78 mg/ml of sucralose. The cultures were incubated at 37° C and 120 rpm. After 5 hours of bacterial growth, the bacterial culture was transferred to a nuclease-free Eppendorf tube and centrifuged at 2500 x g for 5 minutes to collect the cell pellet. To wash the cell pellets, 1 ml of phosphate-buffered saline (PBS) solution was used, and then the mixture was centrifuged at 10,000 x g for 5 minutes. The pellets were suspended in 100 μl of lysozyme solution (10 mg/ml) prepared in PBS and incubated for 15 minutes at 37 °C. After disrupting the bacterial cells with 10 strokes of a sterile syringe with needles, total RNA was isolated using the manufacturer-recommended protocol for the FavorPrepTM Tissue Total RNA Mini Kit. Any contaminated DNA was removed using in-column treatment of samples with RNase-free DNase 1 (18068015, Invitrogen™) following an incubation of 20 minutes at room temperature. Nuclease-free water was used to elute the RNA. The quality of the extracted RNA was checked by measuring the purity and concentration using a micro-volume spectrophotometer. The samples were run in a 1% (w/v) agarose gel in TAE buffer to check the quality of RNA. Once electrophoresis was complete, the RNA bands were visualized under UV light using the Fusion Pulse TS gel documentation system (Vilber) following incubation with ethidium bromide.
The SuperScriptTM III First-Strand Synthesis kit (18080051, Invitrogen™) was used to prepare cDNA from RNA following the protocol provided by the supplier. Five μg of total RNA was taken for each sample, in addition to 1 μl of random hexamers and a mixture of 1 μl of gene-specific primers for the priming of cDNA synthesis. Following cDNA synthesis, the remaining RNA was degraded by adding 1 μl of RNase H to each tube at 37 °C for 20 minutes.
E. coli genes that encode the rate-limiting enzymes of important metabolic pathways (aceE, adk, dxs, pfkA, pfkB, fabI, glgC, thyA, lpd, tdk1, tdk2, and tmk) [25] were chosen for relative gene expression analysis. As the reference gene in expression analysis to normalize the data, DNA gyrase A (gyrA) was used. Sequences were amplified in 15 μl of reaction volume using PowerUp™ SYBR™ Green Master Mix (A25780, Thermo Scientific, Waltham, MS, USA) in a StepOnePlus™ Real-Time PCR System (Applied Biosystems™). Each reaction mixture had the following composition: 7.5 μl PowerUpTM SYBRTM Green Master Mix, 0.6 μl primer pair (forward + reverse) (5 μM each), 4.4 μl nuclease-free water, and 2.5 μl cDNA. The reaction conditions were as follows: one cycle of UDG activation at 50 °C for two minutes, one cycle of Dual-LockTM DNA polymerase activation at 95 °C for two minutes, and forty cycles of denaturation at 95 °C for 15 seconds followed by annealing and extension at 60 °C for one minute. Relevant information about the primers was reported earlier [26,27]. For determining the accuracy of the reactions, two technical replicates were kept for each biological replicate. At the end of each amplification programme, melt curve analysis was performed that assessed the quality of the PCR products. Gel electrophoresis of the PCR products in a 1.5% agarose gel confirmed specific amplification. The slope of the standard curve obtained by serial dilutions of templates was used to calculate primer efficiencies. The fold changes in gene expression were analyzed following the method of Pfaffl [28].
Metabolic profiling and identification of pathways
For metabolite extraction, the same protocol from our previous study was followed [26]. Briefly, 500 μl of the same bacterial cell culture (used for relative gene expression analysis) was utilized for metabolite extraction. Then the metabolite extract was filtered using a 0.2 µm filter. Then the extracted metabolites were stored at -80 °C.
For dilution, first, a dilution solution was prepared with a 3:1 mixture of methanol and water. This mixture was treated with 0.1% formic acid. The extracted metabolites were diluted 100-fold. A dNTP mixture (catalog no. R0191, Thermo Scientific) was used as a reference. The samples were degassed by incubating these in an ultrasonic water bath for 10 minutes. The degassed samples were injected into the 3200 QTRAP LC-MS/MS System (SCIEX) via a syringe pump with a 0.46 mm diameter syringe and a flow rate of 3 μl/min and ion-spray ionization (Ion spray voltage 4500) for global Q1 mass analysis.
The associated pathways in E. coli were discovered using the metabolites with significantly different intensities (False discovery rate or FDR 0.05) between paired groups (untreated vs. stevioside treated, untreated vs. glycyrrhizin treated, and untreated vs. sucralose treated) using the KEGG pathway database and the Mummichog program via Metaboanalyst 5.0.
Statistical analysis
The statistical analysis of the growth curve of the bacteria generated using GraphPad Prism 6 was performed using 2-way ANOVA. For relative gene expression analysis, expression levels were compared using Holm Sidak multiple comparison test. In case of metabolite profiling, statistical analysis was performed using the online tools of MetaboAnalyst 5.0 [29]. Data from each sample was normalized by their respective sum (total ion current) and transformed by auto-scaling (mean-centered and divided by each variable's standard deviation). The global metabolomic profiles of different sweetener treatments were then compared using principal component analysis (PCA), a method of unsupervised multivariate analysis. A heatmap was prepared with the top 50 metabolites based on ANOVA.
RESULTS
Non-caloric sweeteners affect the growth of E. coli
Treatment with a wider concentration range of the three NCS (stevioside, glycyrrhizin, and sucralose) was used to assess their effect on the growth of E. coli (Supplementary Figure 1).
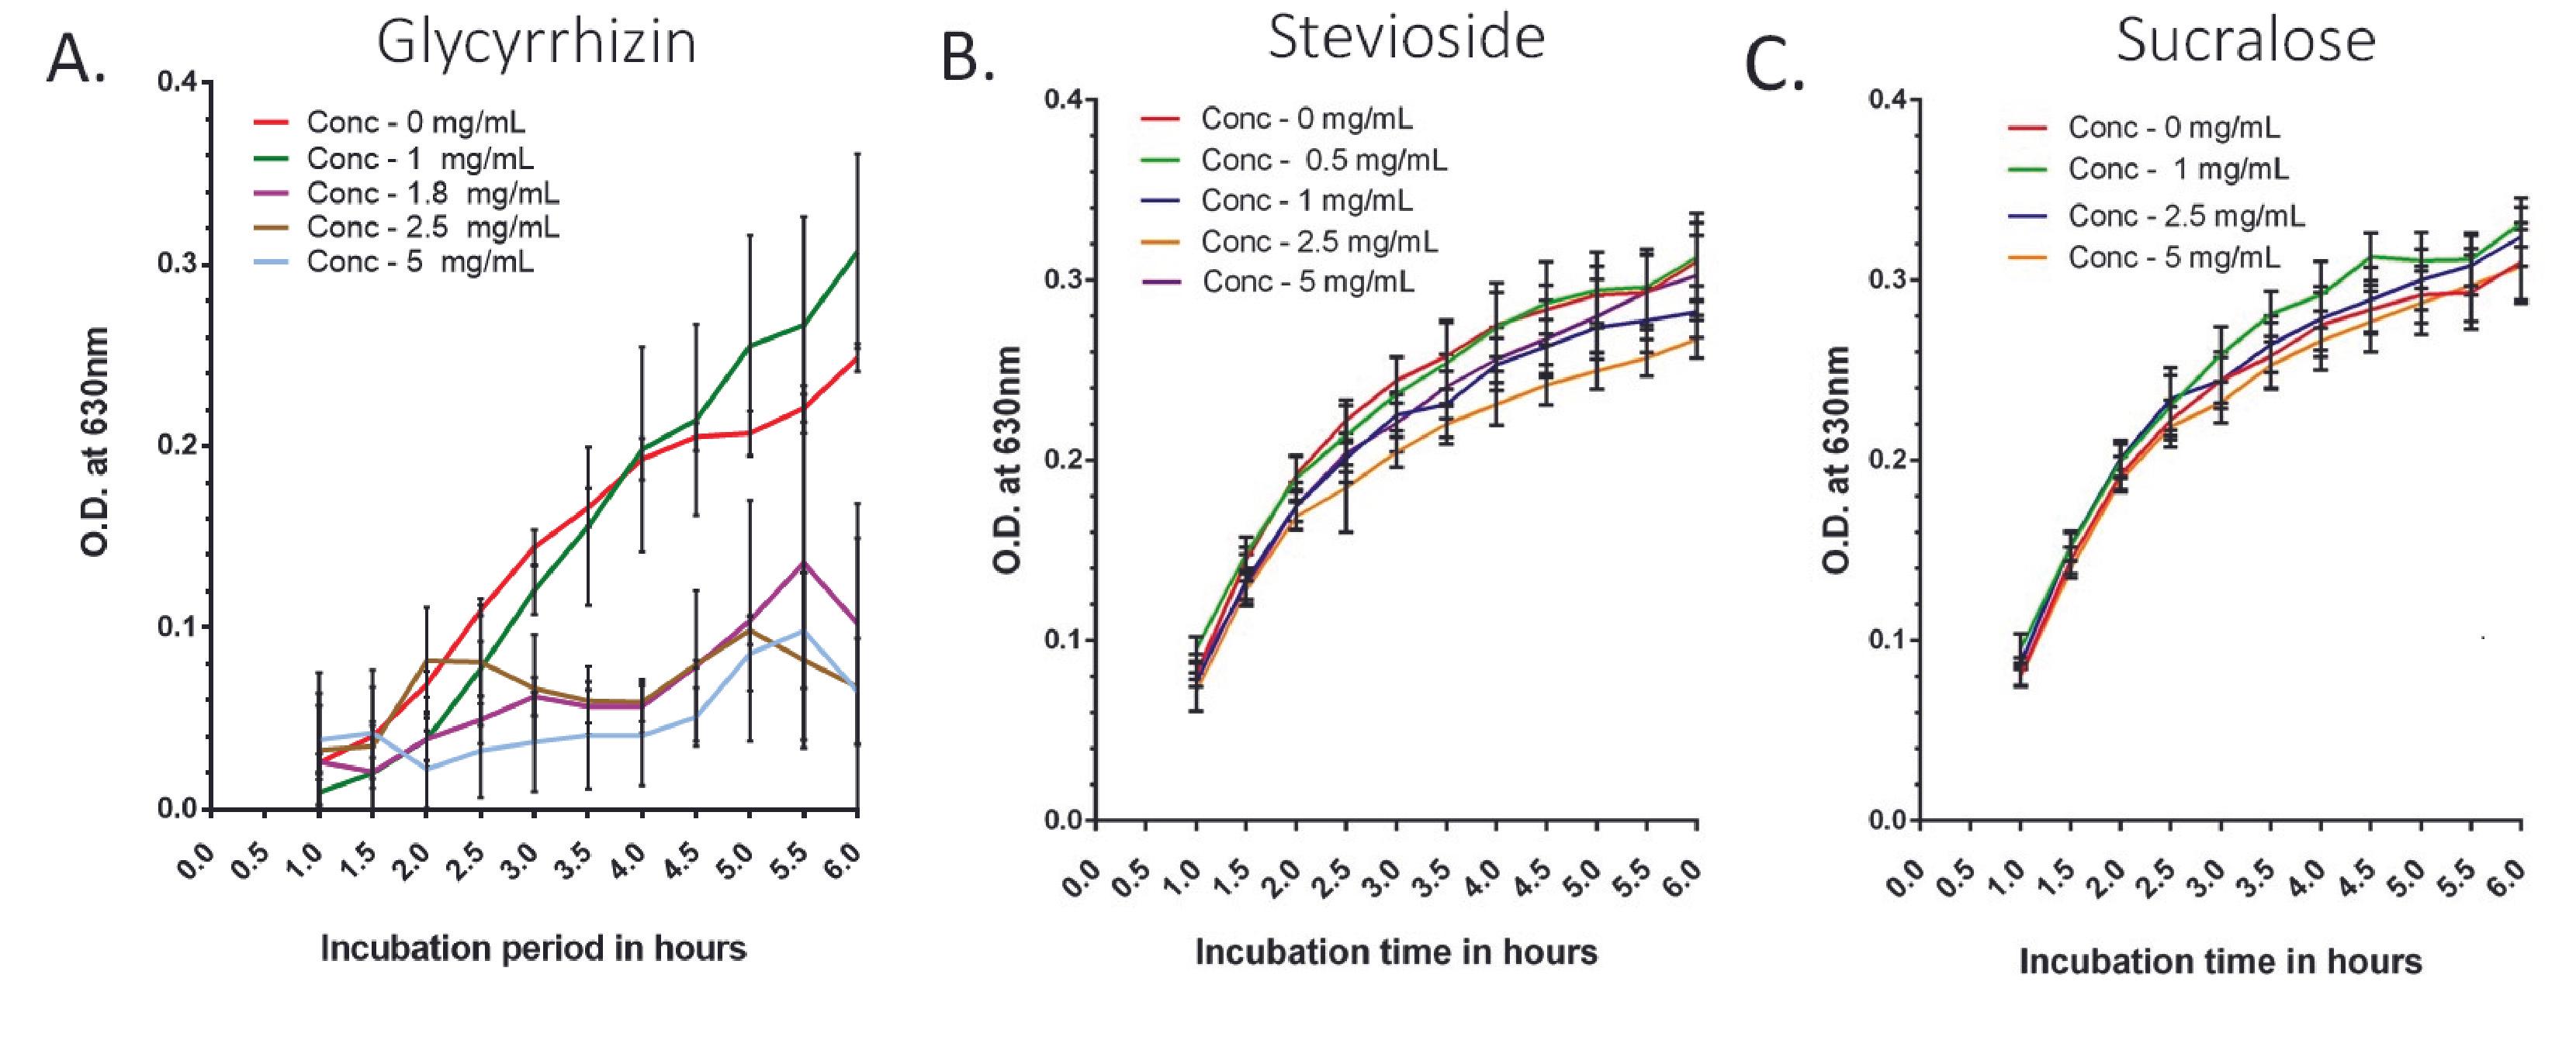
In the case of glycyrrhizin, bacterial growth was considerably (p<0.0001) lower in sweetened media with concentrations of 2 mg/ml and higher than in the control from 2-hour time points to the end (Supplementary Figure 1A). When the effect of the narrower range (Figure 1A and Supplementary Table 1) of glycyrrhizin concentrations (0.5, 1, and 1.8 mg/ml) was investigated, for 0.5 and 1 mg/mL concentrations, the growth of the bacteria in sweetener-treated media was lower at first than the control, but as the time progressed gradually, the bacterial growth became higher than the control at the 3.5-hour time point, and it was significantly (p<0.05) greater at the 6.5-hour and above. The growth of bacteria at a concentration of 1.8 mg/ml was tested, as this is the maximum ADI for glycyrrhizin. In this case, the bacterial growth was significantly (p<0.0001) low compared to the control.
For stevioside, except for the lower doses, increasing the stevioside concentration had a higher inhibitory effect on bacterial growth. At 2-hour and above time points, all concentrations (5, 10, 15, and 20 mg/ml) inhibited growth significantly (p<0.0001) (Supplementary Figure 1B). Lower stevioside concentrations (1 and 2.5 mg/ml) produced growth that was nearly identical to the untreated control (Figure 1B and Supplementary Table 2).
At pH 5.0, E. coli growth in LB media treated with sucralose lagged behind the control at all concentrations (5 to 20 mg/ml) (Supplementary Figure 1C). The higher the concentration of sucralose, the more the growth curve deviated from the control. However, at lower concentrations of sucralose (0.5 and 1 mg/ml), the bacterial growth curve was almost identical to the untreated control (Figure 1C and Supplementary Table 3). For concentrations of 2.5 mg/ml and above, the growth of bacteria significantly decreased.
Non-caloric sweeteners alter the gene expression of E. coli
At different doses of the three NCS, the expression of the investigated genes changed significantly (p<0.05) (Figure 2 and Table 1). Following the treatments with sucralose, the expression of 10 out of the 12 enzymes was significantly altered (p<0.05). The enzymes which remained unaltered are – adk and dxs. Stevioside significantly altered expression of the genes of 4 out of the 12 regulatory enzymes (p<0.05) which are dxs, fabI, lpd, and tmk. Glycyrrhizin alters (p<0.05) the expression of the enzymes aceE, adk, dxs, fabI, glgC, tdk2, thyA, and tmk at one or both concentrations.
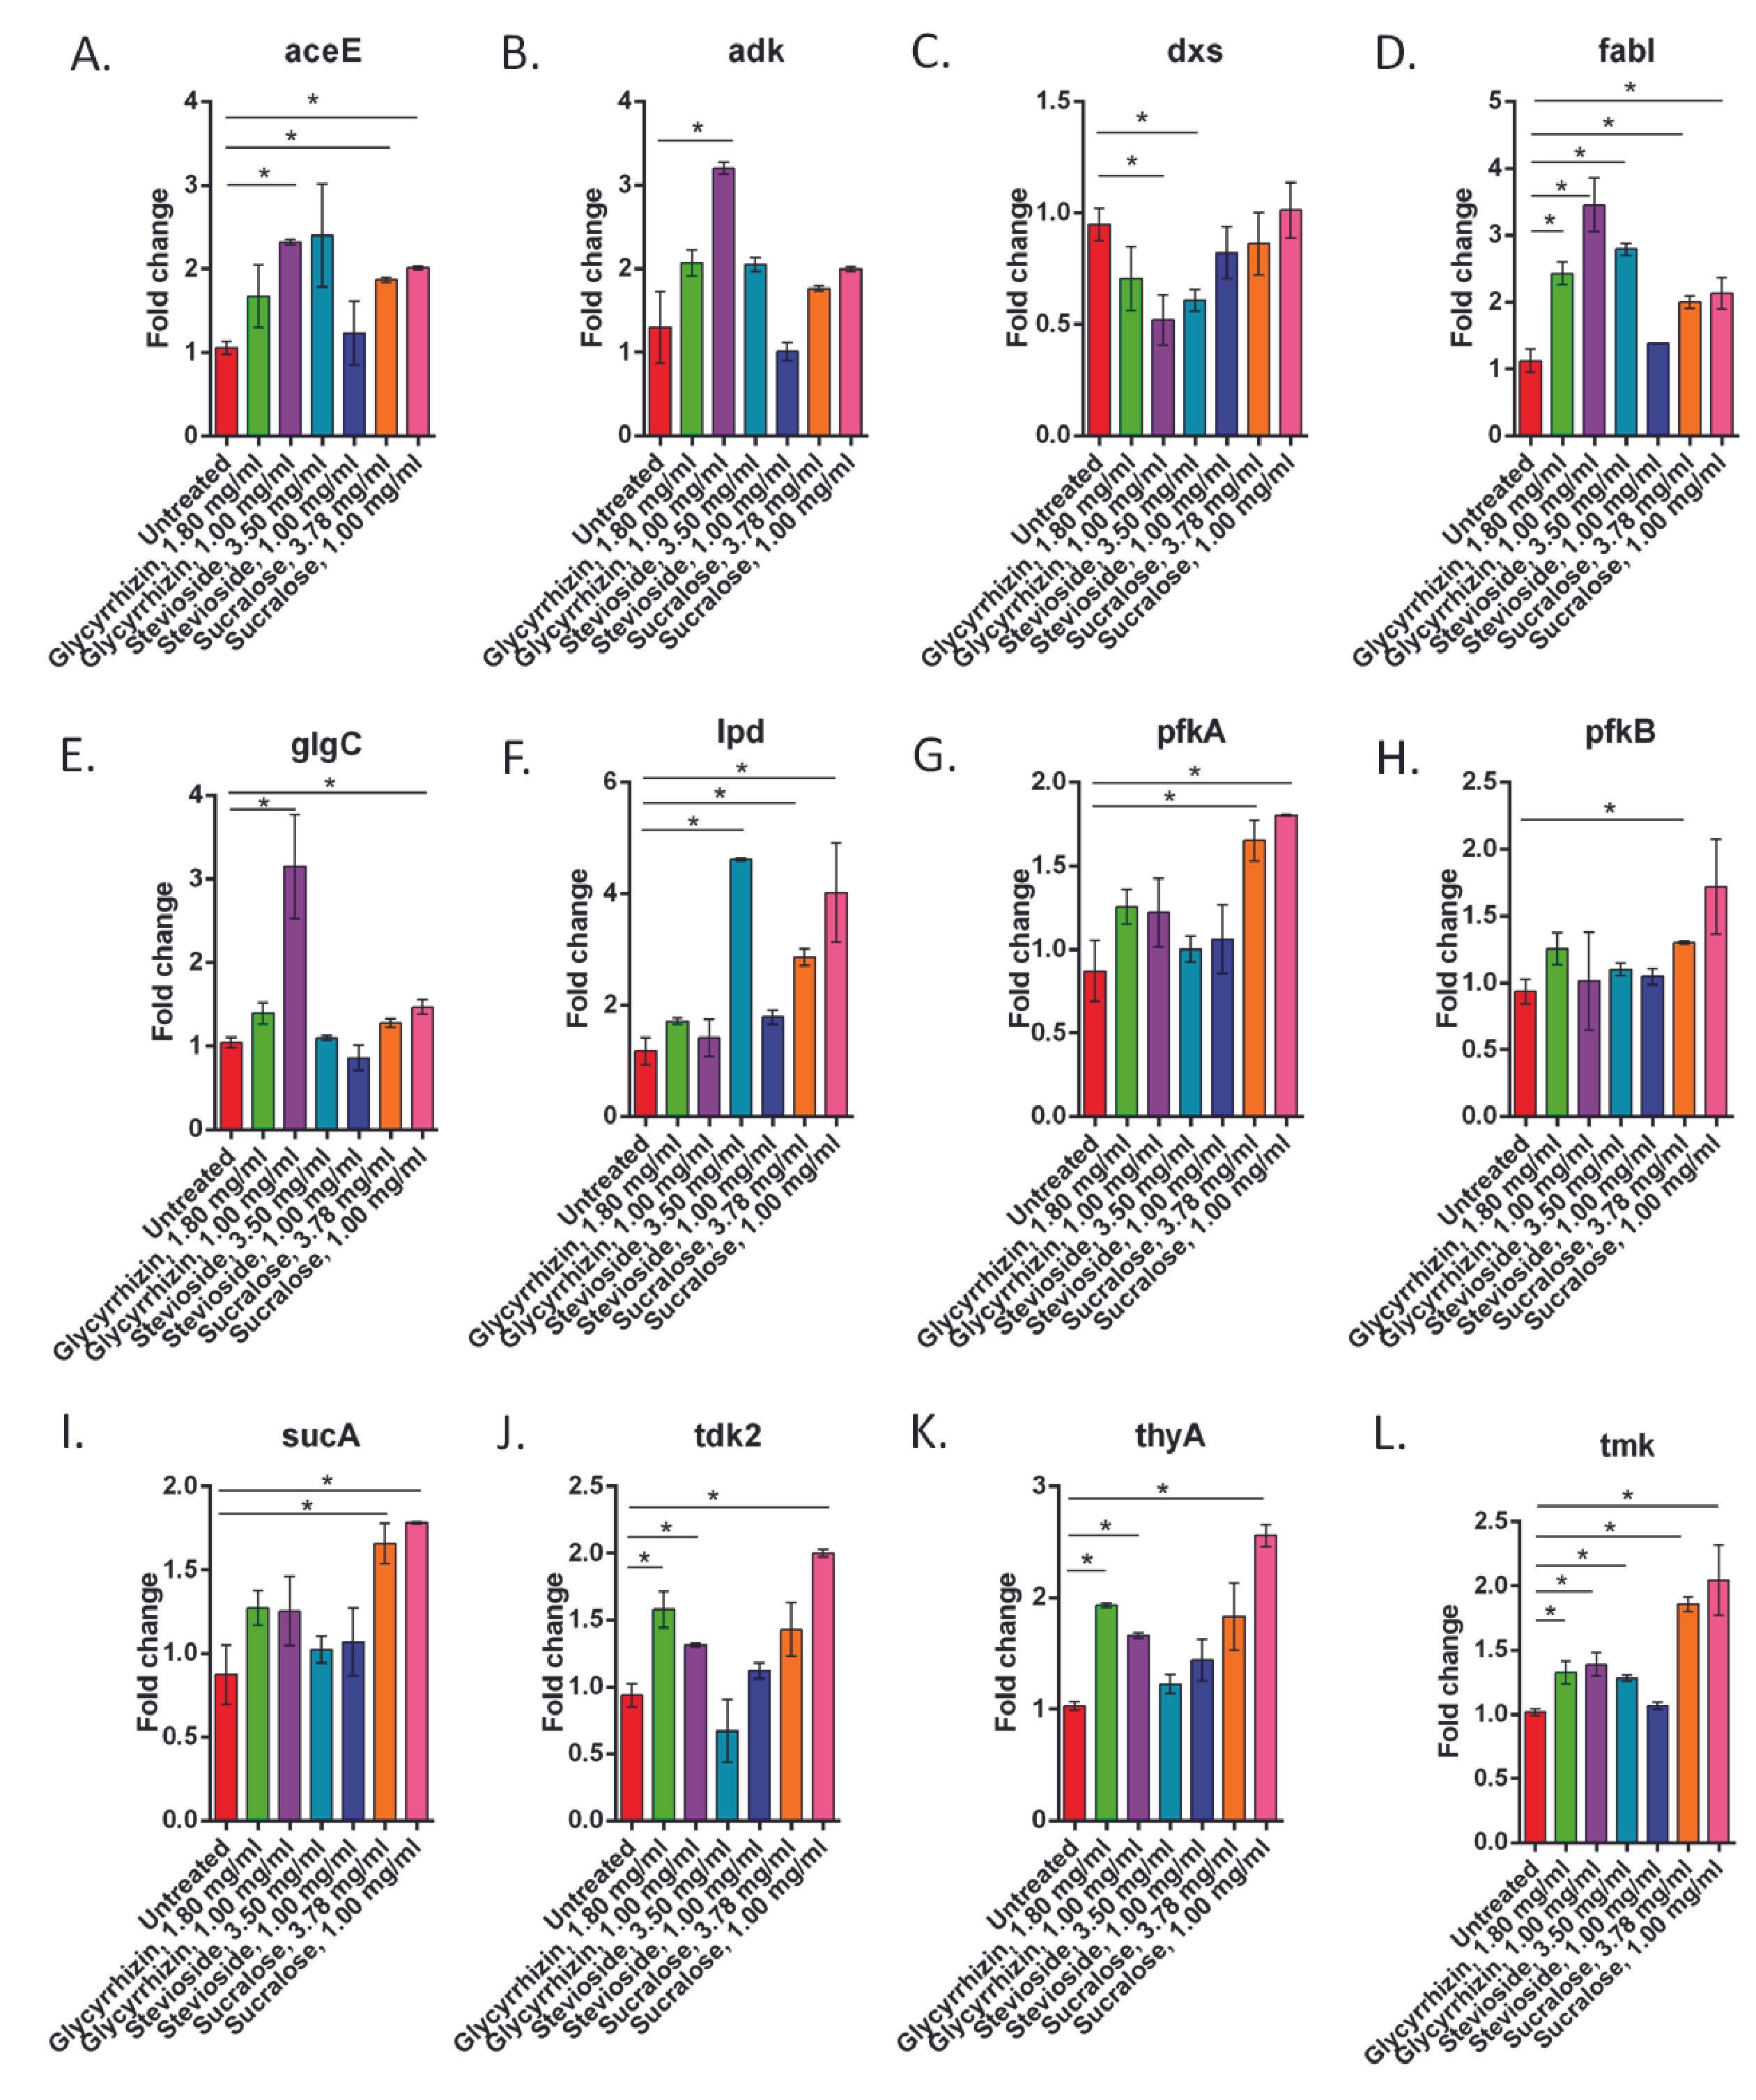
Table 1. Genes and pathways have a significant difference in relative expression levels in NCS-treated cells versus untreated cells.
Non-caloric sweeteners affect the global metabolomic profile of E. coli
The global metabolite profiles of the three NCS-treated E. coli cells were compared to the profiles of the untreated control cells (Figure 3A). In the principal component analysis (PCA) plot, glycyrrhizin-treated cells (with concentrations of 1 mg/ml and 1.8 mg/ml) clustered closer to the untreated cells. The heat map (Figure 3B) also revealed that the untreated sample, glycyrrhizin-treated samples with both concentrations (1 mg/ml and 1.8 mg/ml), and sucralose with a concentration of 3.78 mg/ml had substantially comparable metabolomic profiles. The pathways incorporating the metabolites with altered levels following treatment with NCS were identified using in-silico databases (Table 2).
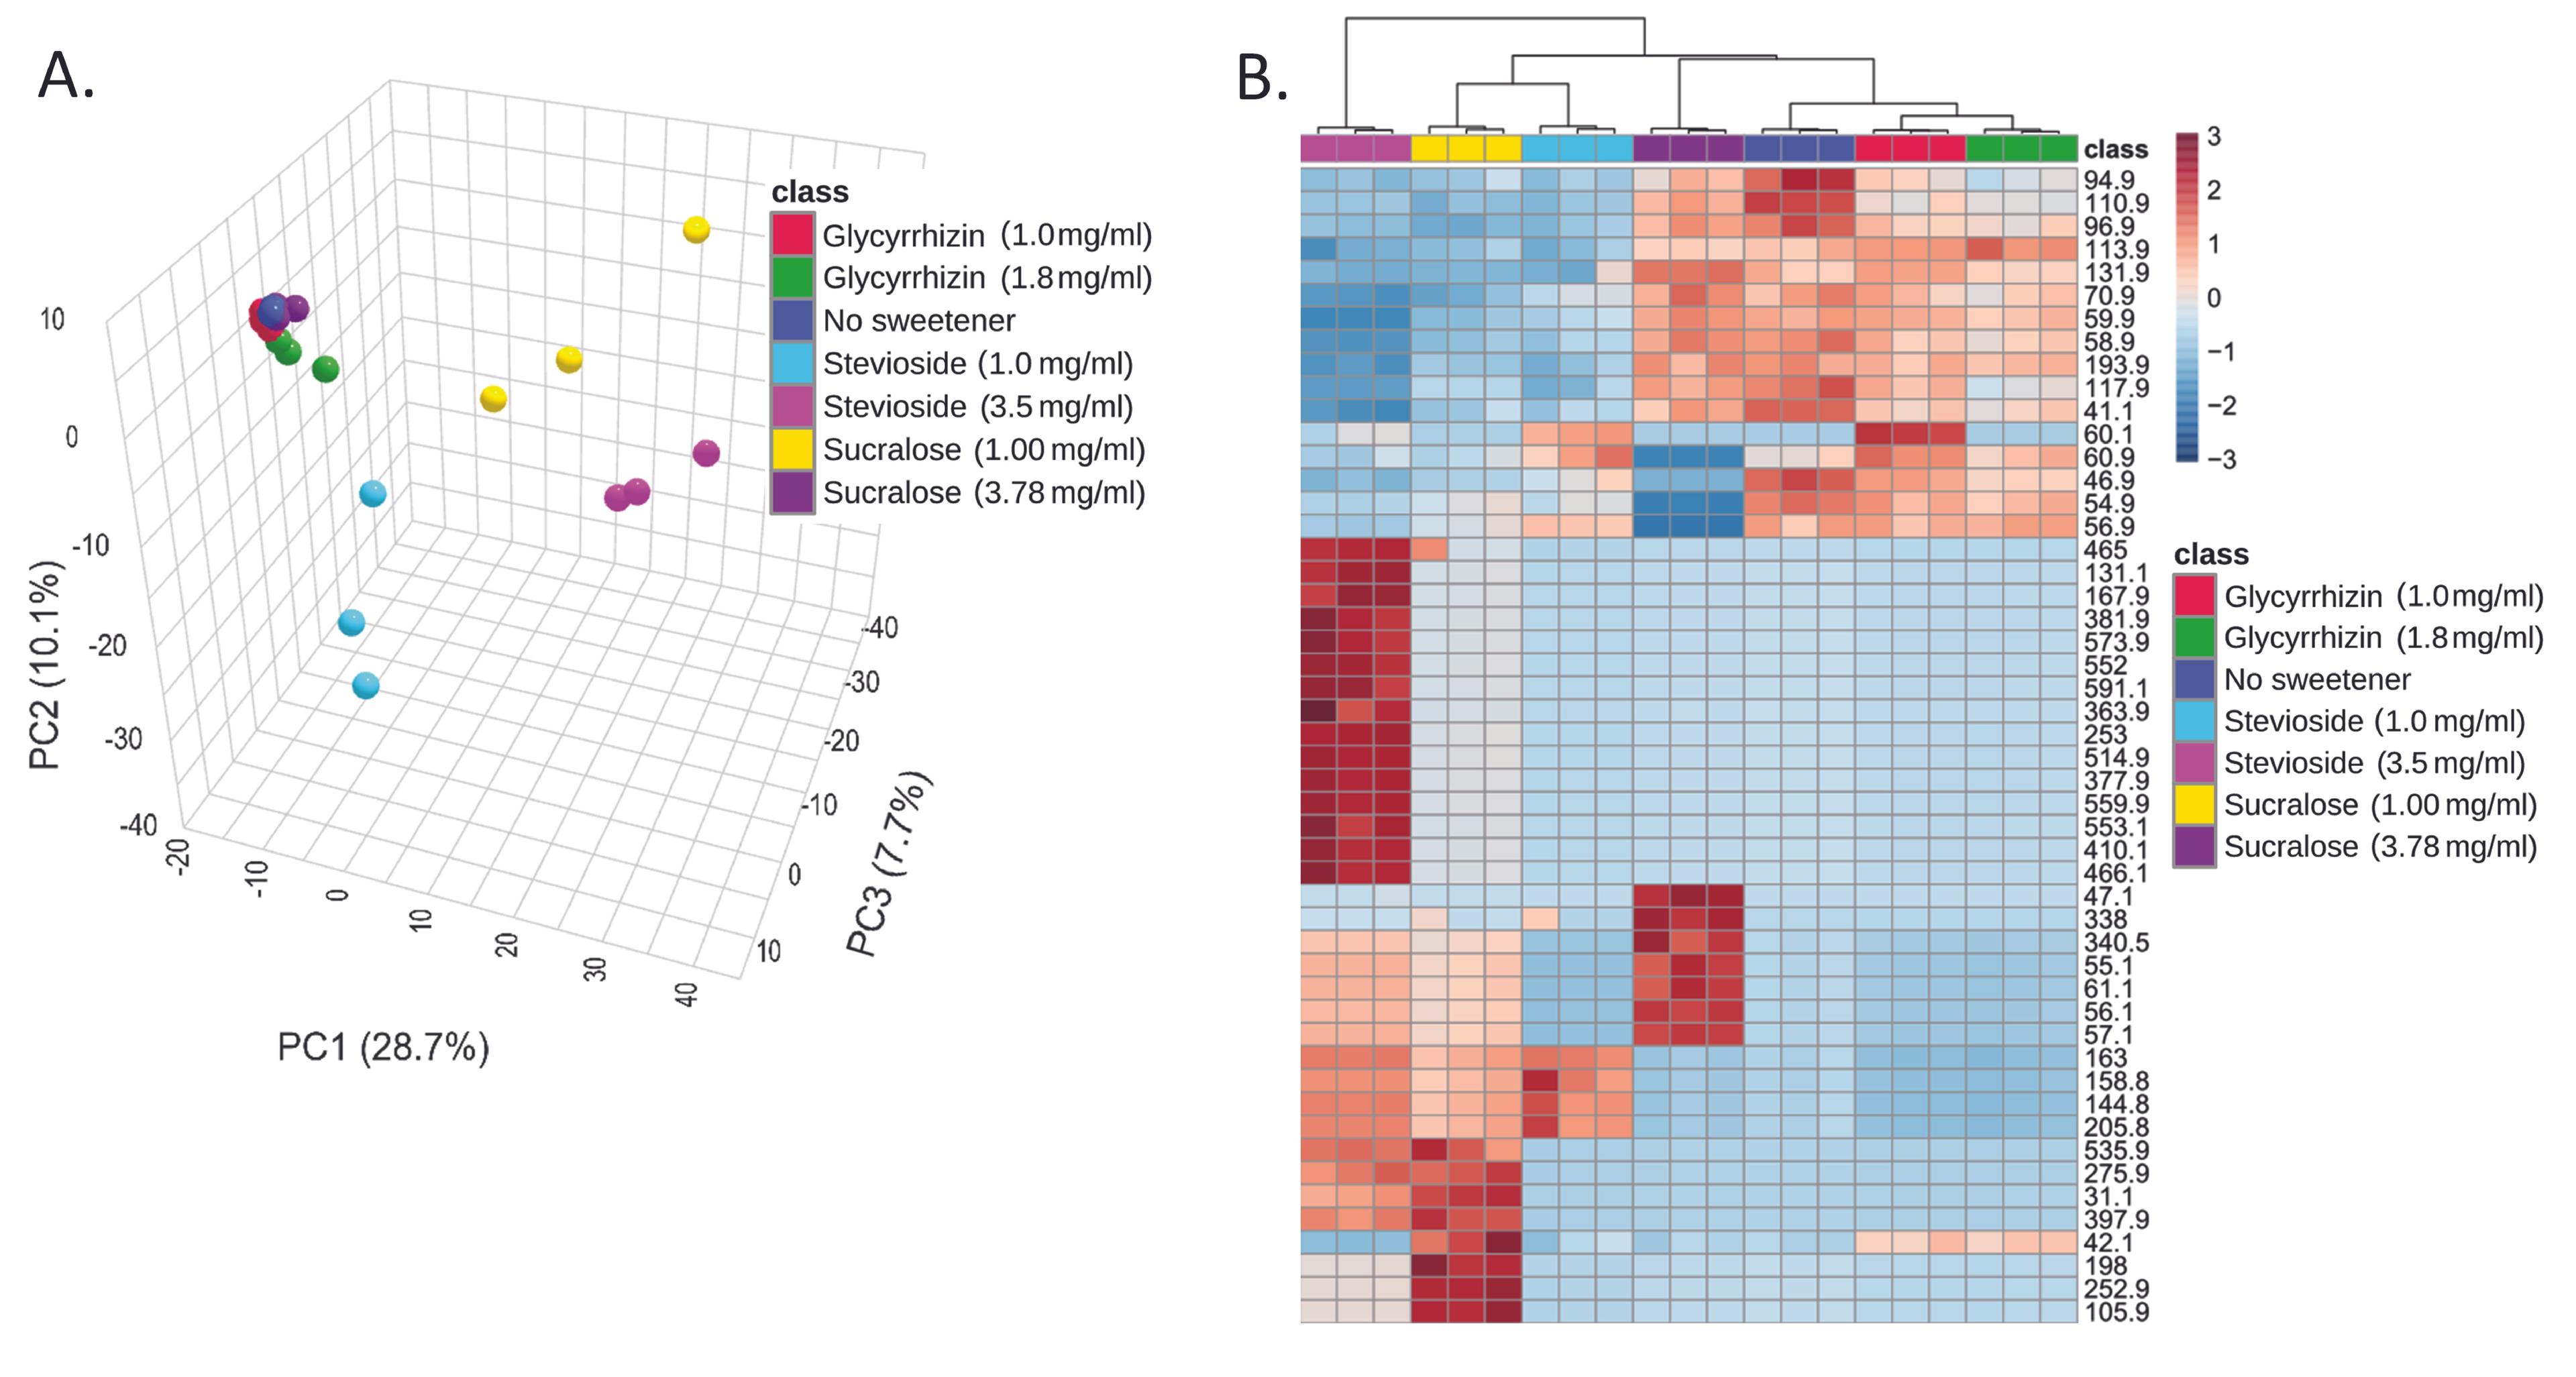
Table 2. The pathways that incorporate metabolites with altered levels following treatment with NCS.
DISCUSSION
In this study, E. coli was grown in the presence of different amounts of glycyrrhizin, stevioside, and sucralose to find out how NCS affects its growth.
The inhibitory effect of glycyrrhizin on E. coli growth in this study is consistent with the findings of other studies [30,31]. This study found that the stevioside concentrations of 1 and 2.5 mg/ml produced growth that was nearly identical to the untreated control. Li et al. [32] reported no effect of stevia (rebaudioside A) at a concentration of 10% (w/v) on the growth of E. coli O157 H7 in broth culture. Again, Gerasimidis et al. [33] investigated the effect of stevia using a human microbiome in batch fermentations and found no significant changes in the growth of E. coli. However, stevioside was shown to cause a significant reduction in the growth of different bacteria, such as Staphylococcus aureus [32], Enterococcus faecalis [34], Bacteroides thetaiotaomicron VPI-5482 [34] and Lactobacillus reuteri [6]. These studies support our findings that increasing the stevioside concentration, except for the lower doses, had a higher inhibitory effect on bacterial growth. The inhibitory effect of sucralose on bacterial growth was shown in previous studies [7]. However, another study showed that sucralose does not have a bactericidal effect. The study suggested that stevia might affect the bacterial communication system through quorum sensing (QS) inhibition and, as a result, might also affect the host metabolism [35].
The relative expression of genes that encode the rate-limiting reactions of major metabolic processes was investigated in this study. ATP-dependent 6-phosphofructokinase-1 (Pfk-1, encoded by pfkA) and 6-phosphofructokinase-2 (Pfk-2, encoded by pfkB) can both catalyze fructose-6-phosphate phosphorylation, although these two isozymes do not have a similar sequence. Pfk-1 is responsible for >90% of this reaction, and Pfk-2 catalyzes <5% of it [36]. Besides the E1 component of pyruvate dehydrogenase (aceE), lipoamide dehydrogenase (lpd) and ADP-glucose pyrophosphorylase (glgC) are also involved in the metabolism of carbohydrates. All these enzymes were significantly up regulated at 1.0 mg/ml and/or 3.78 mg/ml concentrations of sucralose compared to the control. Upregulation of Pfk-1 and Pfk-2 is a possible indication of enhanced production of fructose-1,6-bisphosphate, which indicates the enhanced breakdown of glucose to pyruvate via the glycolytic pathway. For intestinal colonization by E. coli, glycolysis and the Entner-Doudoroff (ED) pathway are required [37]. The aceE gene is involved in the metabolism of propanoate. Propanoate is one of the most common short-chain fatty acids (SCFA) synthesized by intestinal bacteria [37]. Possibly via modifying the intracellular pH of pathogens, propanoate protects hosts from pathogens [38]. It also plays a crucial role in regulating blood pressure. Consequently, variations in propanoate metabolism may have effects on an individual's health [39]. The glgC gene product is associated with glycogen biosynthesis. Glycogen synthesis in E. coli occurs when carbon is abundant, but other nutrients required for growth are limiting [40]. The enzyme is also important in amino sugar and nucleotide sugar metabolism and biofilm formation [36]. Unicellular organisms can temporarily adopt a community lifestyle through biofilm development, which offers them many benefits, such as defense against environmental hazards and accessibility to centralized resources [41]. In addition to the protective function of the biofilm matrix, bacteria within biofilms have a variety of ways to survive that allow them to evade the host's defense mechanisms. These can damage local tissue by going dormant and eluding the immune system, which then starts an acute infection [42]. As a result, the biofilm matrix not only acts as a barrier of protection but also permits bacteria to use survival strategies in challenging conditions, potentially resulting in disease. Among the genes encoding the enzymes of carbohydrate metabolism, lpd is also significantly up-regulated by 3.50 mg/ml stevioside, whereas aceE and glgC are significantly up-regulated by glycyrrhizin, which indicates that stevioside and glycyrrhizin also influence the pathways of glycolysis, pyruvate dehydrogenase, and the tricarboxylic acid (TCA) cycle.
Sucralose and stevioside altered the expression of the lpd gene significantly. Also, the expression of sucA was significantly up regulated in the case of sucralose. These two genes encode enzymes related to the TCA cycle [43]. Effects on the TCA cycle may modulate fatty acid synthesis [44]. Because fatty acids play a critical role in synthesizing phospholipids necessary for constructing the cell membrane, modifications to phospholipids disrupt the structural and functional integrity of the cellular envelope. This disruption affects the organism's capacity to establish biofilms, compromises bacterial fitness, and affects bacterial growth rate, all of which are contingent upon phospholipid presence and composition [45].
Expression of fabI, a gene that encodes Enoyl-Acyl Carrier Protein Reductase and is responsible for fatty acid elongation and biosynthesis [46], was significantly up-regulated at all the concentrations of the three sweeteners (except 1.0 mg/ml stevioside), which indicates that due to a more abundant carbon source, the bacteria also turned to fatty acid production [47]. Free fatty acids (FFAs) have various potent biological effects, including the potential to stop or slow down the growth of bacteria [48]. Many species protect themselves from harmful or parasitic microorganisms by using the antibacterial capabilities of FFAs [49]. Even though the precise mechanism underlying FFAs’ antibacterial activity is still not fully understood, the cell membrane is where they primarily work, interfering with the electron transport chain and oxidative phosphorylation [48]. Butyrate is produced if the gene fabI is overexpressed in E. coli [50]. Butyrate potentially assumes protective functions against conditions such as diabetes, obesity, cancer, inflammatory bowel disease, etc., elicits epigenetic modifications within the host, and regulates the host's behavior [51]. Butyrate is also one of the main SCFAs [37].
This study investigated the expression of four genes (adk, tdk, tmk, and thyA) that encode rate-limiting enzymes of nucleotide biosynthesis. The enzyme adk is involved in the de novo biosynthesis of purines and converts the ribonucleoside adenosine into 5′-adenosine-monophosphate. It has a role in the de novo and salvage pathways of pyrimidine synthesis [36]. In this study, the expression of adk was significantly up-regulated only following treatment with glycyrrhizin. The expression of tdk and thyA, which perform in the salvage and de novo pathways of pyrimidine biosynthesis, respectively [36,43], was up-regulated by sucralose and glycyrrhizin. The expression of tmk was up-regulated significantly by all three sweeteners. This enzyme also participates in the de novo pathway of pyrimidine biosynthesis [36]. The result is indicative of the fact that the sweeteners increase the nucleotide biosynthesis process significantly, although it does not corroborate with the reduction of bacterial growth. A study has shown that a rise in the guanine nucleotide pool initiates an augmentation in the adenine nucleotide pool, which imposes limitations in the synthesis of the central intermediary metabolite phosphoribosyl pyrophosphate (PRPP), leading to a state of deficiency for pyrimidines and for the amino acids such as histidine and tryptophan, the synthesis of all of which requires PRPP. Consequently, the starvation for histidine and tryptophan triggers the accumulation of the regulatory nucleotide ppGpp, the pivotal mediator of the ‘stringent response’ to amino acid scarcity, and functions to suppress the synthesis of rRNA, tRNA, and some mRNAs when substrates necessary for protein synthesis are constrained, which leads to the inhibition of bacterial growth [52].
When the global metabolite profiles of the three NCS-treated E. coli cells were compared to the profiles of the untreated control cells, in the principal component analysis (PCA) plot, the glycyrrhizin-treated cells clustered closer to the untreated cells. The heat map also showed that the untreated sample, glycyrrhizin-treated samples with both concentrations, and sucralose with a higher concentration had considerably comparable metabolomic profiles, which might correlate with the previous report that glycyrrhizin enhanced the presence of beneficial bacteria, such as Bifidobacterium spp. and Faecalibacterium prausnitzii, while decreasing the abundance of some pathobiont bacteria [53]. Also, glycyrrhizin shows anti-diabetic action in diabetic mice through the modulation of the gut microbiota and the signaling pathway involving colon TLR4/ NF-κB [54]. A study on glycyrrhizic acid (GA) shows that GA counteracted a high-fat diet (HFD)-enhanced gut microbiota dysbiosis [30].
Among the pathways that incorporate the metabolites identified using in-silico databases, stevioside was found to modulate inositol phosphate metabolism. Myo-inositol 1,2,3,5,6-pentakisphosphate of this pathway was identified as a metabolite by MetaboAnalyst 5.0 [29]. Recent studies have demonstrated that inositols, particularly myo-inositol and inositol hexakisphosphate, exert a variety of health benefits [55]. Although their involvement in cancer treatment and prevention has been thoroughly documented, these molecules are recognized for their capacity to diminish insulin resistance, enhance insulin sensitivity, and possess a variety of features that are important for cell signaling and metabolism [56]. Inositol phosphates may speed up the browning of white adipocytes and directly enhance their insulin sensitivity [57]. It has been demonstrated that inositol pyrophosphates increase cellular energetics via increasing glycolysis and mitochondrial activity [58]. This inositol phosphate metabolism is related to glycolysis/gluconeogenesis, citrate or TCA cycle, pentose and glucuronate interconversions, and glycerophospholipid metabolism [59]. Genes responsible for these pathways, like aceE, pfkA, pfkB, lpd, sucA, and glgC, are altered by the three sweeteners (Table 1).
The porphyrin metabolism pathway was modulated by stevioside, sucralose, and glycyrrhizin (Table 2). Bacterial porphyrins are known to be pro-inflammatory. Porphyrins play essential roles in providing defense against pathogens and eliciting an inflammatory response [60]. Heme O is included in this metabolic pathway [29]. Alanine, aspartate, and glutamate metabolism, purine metabolism, glycine, serine, and threonine metabolism, as well as riboflavin metabolism, are related to the porphyrin metabolism pathway [59].
Phosphonate and phosphinate metabolism were identified as being modulated by stevioside and glycyrrhizin (Table 2), which was also seen in a previous study [26]. Glycolysis/gluconeogenesis, pentose phosphate pathway, and glycine, serine, and threonine metabolism are related to phosphonate and phosphinate metabolism, whose genes like aceE, pfkA, pfkB, lpd, and glgC are altered by the three sweeteners (Table 1) [59]. In addition, pathways such as nucleotide metabolism, amino acid (such as tryptophan) metabolism, and folate biosynthesis were modulated by the NCS (Table 2). Sucralose-treated samples also had altered levels of metabolites of the thiamine metabolism pathway, which is consistent with the up-regulation of the dxp gene in sucralose-treated bacteria.
CONCLUSION
Human health and disease are significantly influenced by the bacteria in the gut. Dietary intake influences the composition and functions of the gut microbiota. NCS-mediated alteration of the gut microbial ecosystem and metabolic diseases due to reshaped gut microflora may be correlated to the mechanisms involved in the adverse effects of these sweeteners. In this study, we investigated the effects of glycyrrhizin, stevioside, and sucralose on the growth and metabolism of the omnipresent gut habitant E. coli. Under in vitro environments, 1 mg/ml glycyrrhizin and 3.78 mg/ml sucralose appear to have the least distorting effect on E. coli growth, gene expression, and metabolism. The findings in this study might aid in understanding the effect of these three NCS on the growth and metabolism of gut microbes. However, the study was limited to E. coli only. Further investigation is needed to determine the effect of the sweeteners on other gut flora and in vivo conditions.
ACKNOWLEDGEMENT
This study was supported by a grant from the University Grants Commission (No. Biol. 15_2020-21), Bangladesh. The authors are thankful for the support.
AUTHOR CONTRIBUTIONS
Design of the work: SS, AAS; Acquisition, analysis, and interpretation of data: SST, AK; Manuscript preparation and reviewing: SST, SA, SS, AAS.
CONFLICTS OF INTEREST
There is no conflict of interest among the authors.
SUPPLEMENTARY MATERIALS
Supplementary Figure 1. Growth of E. coli in LB media supplemented with a broad concentration range of NCS glycyrrhizin, stevioside, and sucralose; Supplementary Table 1. Growth of E. coli in LB medium supplemented with different concentrations of glycyrrhizin; Supplementary Table 2. Growth of E. coli in LB medium supplemented with different concentrations of stevioside; and Supplementary Table 3. Growth of E. coli in LB medium supplemented with different concentrations of sucralose (Supplementary materials).
References
- [1]Lohner S, Toews I, et al. Health outcomes of non-nutritive sweeteners: analysis of the research landscape. Nutr J. 2017; 16: 55.
- [2]Richardson IL, Frese SA. Non-nutritive sweeteners and their impacts on the gut microbiome and host physiology. Front Nutr. 2022; 9: 988144.
- [3]Abd El-Lahot MS, Abd El-Razek AM, et al. Utilization of Glycyrrhizin and Licorice Extract as Natural Sweetener in Some Food Products and Biological Impacts. J Food Dairy Sci. 2017; 8: 127–136.
- [4]Sayers EW, Beck J, et al. Database resources of the National Center for Biotechnology Information. Nucleic Acids Res. 2021; 49: D10–D17
- [5]Ruiz-Ojeda FJ, Plaza-Díaz J, et al. Effects of Sweeteners on the Gut Microbiota: A Review of Experimental Studies and Clinical Trials. Adv Nutr. 2019; 10: S31–S48
- [6]Peteliuk V, Rybchuk L, et al. Natural sweetener Stevia rebaudiana: Functionalities, health benefits and potential risks. EXCLI J. 2021; 20: 1412–1430.
- [7]Wang QP, Browman D, et al. Non-nutritive sweeteners possess a bacteriostatic effect and alter gut microbiota in mice. PLoS One. 2018; 13: e0199080.
- [8]Schiffman SS, Rother KI. Sucralose, A Synthetic Organochlorine Sweetener: Overview Of Biological Issues. J Toxicol Environ Heal Part B. 2013; 16: 399–451.
- [9]Nobs SP, Elinav E. Nonnutritive sweeteners and glucose intolerance: Where do we go from here? J Clin Invest. 2023; 133: :e171057.
- [10]Wilk K, Korytek W, et al. The Effect of Artificial Sweeteners Use on Sweet Taste Perception and Weight Loss Efficacy: A Review. Nutrients. 2022; 14: 1261.
- [11]Roberts A, Renwick AG, et al. Sucralose metabolism and pharmacokinetics in man. Food Chem Toxicol. 2000; 38: 31–41.
- [12]Fan Y, Pedersen O. Gut microbiota in human metabolic health and disease. Nat Rev Microbiol. 2021; 19: 55–71.
- [13]Conz A, Salmona M, et al. Effect of Non-Nutritive Sweeteners on the Gut Microbiota. Nutrients. 2023; 15: 1869.
- [14]Mueller NT, Bakacs E, et al. The infant microbiome development: mom matters. Trends Mol Med. 2015; 21: 109–117.
- [15]Qin J, Li Y, et al. A metagenome-wide association study of gut microbiota in type 2 diabetes. Nature. 2012; 490: 55–60.
- [16]Ishaq HM, Mohammad IS, et al. Molecular estimation of alteration in intestinal microbial composition in Hashimoto’s thyroiditis patients. Biomed Pharmacother. 2017; 95: 865–874.
- [17]Marsh R, Gavillet H, et al. Intestinal function and transit associate with gut microbiota dysbiosis in cystic fibrosis. J Cyst Fibros. 2022; 21: 506–513.
- [18]Zhang Y, Si X, et al. Association between intestinal microbiota and inflammatory bowel disease. Anim Model Exp Med. 2022; 5: 311–322.
- [19]He X, Sun J, et al. Compositional Alterations of Gut Microbiota in Patients with Diabetic Kidney Disease and Type 2 Diabetes Mellitus. Diabetes, Metab Syndr Obes Targets Ther. 2022; Volume 15: 755–765.
- [20]Baumgart M, Dogan B, et al. Culture independent analysis of ileal mucosa reveals a selective increase in invasive Escherichia coli of novel phylogeny relative to depletion of Clostridiales in Crohn’s disease involving the ileum. ISME J. 2007; 1: 403–418.
- [21]Liu S, Zhao W, et al. Metagenomic analysis of the gut microbiome in atherosclerosis patients identify cross‐cohort microbial signatures and potential therapeutic target. FASEB J. 2020; 34: 14166–14181.
- [22]Losol P, Sokolowska M, et al. Interactions between microbiome and underlying mechanisms in asthma. Respir Med. 2023; 208: 107118.
- [23]Gasımova M, Gurbanov A. Changes in the normal intestinal microflora during Helicobacter pyloriassociated gastroduodenal diseases. Sci Collect «InterConf». 2022; 176–177.
- [24]Gryp T, Huys GRB, et al. Isolation and Quantification of Uremic Toxin Precursor-Generating Gut Bacteria in Chronic Kidney Disease Patients. Int J Mol Sci. 2020; 21: 1986.
- [25]Zhao M, Chen X, et al. RLEdb: a database of rate-limiting enzymes and their regulation in human, rat, mouse, yeast and E. coli. Cell Res. 2009; 19: 793–795.
- [26]Shahriar S, Ahsan T, et al. Aspartame, acesulfame K and sucralose- influence on the metabolism of Escherichia coli. Metab Open. 2020; 8: 100072.
- [27]Mahmud R, Shehreen S, et al. Non-Caloric Artificial Sweeteners Modulate the Expression of Key Metabolic Genes in the Omnipresent Gut Microbe Escherichia coli. Microb Physiol. 2019; 29: 43–56
- [28]Pfaffl MW. A new mathematical model for relative quantification in real-time RT-PCR. Nucleic Acids Res. 2001; 29: 45e – 45.
- [29]Pang Z, Chong J, et al. MetaboAnalyst 5.0: narrowing the gap between raw spectra and functional insights. Nucleic Acids Res. 2021; 49: W388–W396.
- [30]Qiu M, Huang K, et al. Modulation of intestinal microbiota by glycyrrhizic acid prevents high-fat dietenhanced pre-metastatic niche formation and metastasis. Mucosal Immunol. 2019; 12: 945–957.
- [31]Reda FM, El-Saadony MT, et al. Dietary effect of licorice (Glycyrrhiza glabra) on quail performance, carcass, blood metabolites and intestinal microbiota. Poult Sci. 2021; 100: 101266.
- [32]Li S, Chen T, et al. The Effects of Rebaudioside A on Microbial Diversity in Mouse Intestine. Food Sci Technol Res. 2014; 20: 459–467.
- [33]Gerasimidis K, Bryden K, et al. The impact of food additives, artificial sweeteners and domestic hygiene products on the human gut microbiome and its fibre fermentation capacity. Eur J Nutr. 2020; 59: 3213–3230.
- [34]Fengyang L, Yunhe F, et al. Stevioside Suppressed Inflammatory Cytokine Secretion by Downregulation of NF-κB and MAPK Signaling Pathways in LPS-Stimulated RAW264.7 Cells. Inflammation. 2012; 35: 1669–1675.
- [35]Markus V, Share O, et al. Inhibitory Effects of Artificial Sweeteners on Bacterial Quorum Sensing. Int J Mol Sci. 2021; 22: 9863.
- [36]Bateman A, Martin M-J, et al. UniProt: the Universal Protein Knowledgebase in 2023. Nucleic Acids Res. 2023; 51: D523–D531.
- [37]Rinninella E, Raoul P, et al. What is the Healthy Gut Microbiota Composition? A Changing Ecosystem across Age, Environment, Diet, and Diseases. Microorganisms. 2019; 7: 14.
- [38]Lund PA, De Biase D, et al. Understanding How Microorganisms Respond to Acid pH Is Central to Their Control and Successful Exploitation. Front Microbiol. 2020; 11.
- [39]Samuel BS, Shaito A, et al. Effects of the gut microbiota on host adiposity are modulated by the shortchain fatty-acid binding G protein-coupled receptor, Gpr41. Proc Natl Acad Sci. 2008; 105: 16767–16772.
- [40]Dauvillée D, Kinderf IS, et al. Role of the Escherichia coli glgX Gene in Glycogen Metabolism. J Bacteriol. 2005; 187: 1465–1473.
- [41]Floyd KA, Eberly AR, et al. Adhesion of bacteria to surfaces and biofilm formation on medical devices. In: Biofilms and Implantable Medical Devices. Elsevier; 2017. p. 47–95.
- [42]Vestby LK, Grønseth T, et al. Bacterial Biofilm and its Role in the Pathogenesis of Disease. Antibiotics. 2020; 9: 59.
- [43]Keseler IM, Collado-Vides J, et al. EcoCyc: a comprehensive database of Escherichia coli biology. Nucleic Acids Res. 2011; 39: D583–D590.
- [44]Pavoncello V, Barras F, et al. Degradation of Exogenous Fatty Acids in Escherichia coli. Biomolecules. 2022; 12: 1019
- [45]Rowlett VW, Mallampalli VKPS, et al. Impact of Membrane Phospholipid Alterations in Escherichia coli on Cellular Function and Bacterial Stress Adaptation. J Bacteriol. 2017; 199.
- [46]Bergler H, Fuchsbichler S, et al. The Enoyl-[Acyl-Carrier-Protein] Reductase (FabI) of Escherichia coli, which Catalyzes a Key Regulatory Step in Fatty Acid Biosynthesis, Accepts NADH and NADPH as Cofactors and is Inhibited by Palmitoyl-CoA. Eur J Biochem. 1996; 242: 689–694
- [47]Janßen H, Steinbüchel A. Fatty acid synthesis in Escherichia coli and its applications towards the production of fatty acid based biofuels. Biotechnol Biofuels. 2014; 7: 7.
- [48]Desbois AP, Smith VJ. Antibacterial free fatty acids: activities, mechanisms of action and biotechnological potential. Appl Microbiol Biotechnol. 2010; 85: 1629–1642.
- [49]Yoon B, Jackman J, et al. Antibacterial Free Fatty Acids and Monoglycerides: Biological Activities, Experimental Testing, and Therapeutic Applications. Int J Mol Sci. 2018; 19: 1114.
- [50]Vick JE, Clomburg JM, et al. Escherichia coli Enoyl-Acyl Carrier Protein Reductase (FabI) Supports Efficient Operation of a Functional Reversal of the β-Oxidation Cycle. Appl Environ Microbiol. 2015; 81: 1406–1416.
- [51]Mayorga-Ramos A, Barba-Ostria C, et al. Protective role of butyrate in obesity and diabetes: New insights. Front Nutr. 2022; 9.
- [52]Petersen C. Inhibition of cellular growth by increased guanine nucleotide pools. Characterization of an Escherichia coli mutant with a guanosine kinase that is insensitive to feedback inhibition by GTP. J Biol Chem. 1999; 274: 5348–5356.
- [53]Authier H, Bardot V, et al. Synergistic Effects of Licorice Root and Walnut Leaf Extracts on Gastrointestinal Candidiasis, Inflammation and Gut Microbiota Composition in Mice. Microbiol Spectr. 2022; 10: e023552.
- [54]Yang L, Jiang Y, et al. The anti-diabetic activity of licorice, a widely used Chinese herb. J Ethnopharmacol. 2020; 263: 113216.
- [55]Dinicola S, Minini M, et al. Nutritional and Acquired Deficiencies in Inositol Bioavailability. Correlations with Metabolic Disorders. Int J Mol Sci. 2017; 18: 2187.
- [56]DiNicolantonio JJ, H O’Keefe J. Myo-inositol for insulin resistance, metabolic syndrome, polycystic ovary syndrome and gestational diabetes. Open Hear. 2022; 9: e001989.
- [57]Kim JN, Han SN, et al. Phytic acid and myo-inositol support adipocyte differentiation and improve insulin sensitivity in 3T3-L1 cells. Nutr Res. 2014; 34: 723–731.
- [58]Chatree S, Thongmaen N, et al. Role of Inositols and Inositol Phosphates in Energy Metabolism. Molecules. 2020; 25: 5079.
- [59]Kanehisa M, Sato Y, et al. KEGG as a reference resource for gene and protein annotation. Nucleic Acids Res. 2016; 44: D457–D462.
- [60]Barnard E, Johnson T, et al. Porphyrin Production and Regulation in Cutaneous Propionibacteria. MSphere. 2020; 5: e00793-19.