Investigation of growth performance, lipid profile, and liver histotexure of mice treated with butyric acid
Abstract
Obesity is a pandemic which adds greatly to health care costs through its association with type 2 diabetes, metabolic syndrome, cardiovascular disease, and cancers. The aim of this research is to investigate the effects of different concentrations of butyric acid on changes of body weight, blood biochemical parameters, and liver histotexture in mice. Total twenty Swiss albino mice were divided into 4 groups viz Group A, B, C and D. Group A act as control while Group B, Group C and Group D were received 3, 5, and 7 mM/kg body weight butyric acid respectively, throughout the experimental period. On the 60th day, blood and liver samples were collected for biochemical analysis and histopathology respectively. Results showed that body weight increased significantly (p<0.05) in Group C and D compared to control. The total cholesterol (TC) and triglyceride (TG) were significantly higher in Group B (p<0.05) and D (p<0.01) compared to the control group. The high-density lipoprotein (HDL) was increased significantly (p<0.05) in Group D whereas no significant changes were found in low density lipoprotein (LDL) level compared to control. The serum glucose was significantly higher in Group B, C (p<0.05) and D(p<0.01) than control group. In histopathological studies, liver of group B showed slight hepatocellular degeneration whereas group C and D showed vacuolation of hepatocytes. From the above findings it can be concluded that higher concentration of butyric acid may cause rise in body weight, the lipid profile and degenerative hepatocellular changes in mice, whereas lower concentration did not make significant changes.
INTRODUCTION
The short chain fatty acids (SCFAs) such as acetate, propionate, and butyrate are the main metabolites of dietary fibers those are produced in the colon of digestive tract by bacterial fermentation. Highly-fermentable fiber residues from resistant starch, oat bran, pectin and are converted into SCFAs by colonic bacteria [1]. The SCFAs such as; acetate, propionate, and butyrate are a product of the metabolism of polysaccharides that are not digested by the digestive system enzymes [2]. Butyrate is commonly found in animal fats and plant oils in a esterified form [3]. One of the best sources of dietary butyric acid is butter and butter like dietary products. Among the fat constituents of Swedish milk, almost 70% is saturated fat of which around 11% comprises SCFAs, and nearly half of which is butyric acid [4]. Bovine milk, breast-milk, butter, parmesan cheese, body odor, vomit, produced by anaerobic fermentation can be noted as some other sources of butyric acid [5]. Consumption of butyrate rich dietary sources is linked to so many beneficial effects for health like energy homeostasis, immune system regulation, brain function, amelioration of cancer etc. [6][7]. Sodium butyrate is one of the most common forms of the supplement and as a supplemental therapy microencapsulated sodium butyrate is capable to reduce the frequency of selected clinical symptoms in patients with IBS (Irritable Bowel Disease), without being significantly involved on reducing symptom severity [8]. Through the production of anti-inflammatory cytokines and induction of tolerogenic dendritic cells, butyrate regulates epithelial inflammation and tolerance to antigens. It plays a significant role in the pathogenesis and treatment of malabsorptive states and intestinal neoplasia, and provides scope for the potential translation of butyrate’s cellular function into clinical therapies [9]. Butyrate is very effective in inducing clinical improvement/remission of various diseases such as Crohn’s disease where oral butyrate is recommended as safe and well tolerated [10].
Although there are lots of health benefits of butyric acid, high concentration of saturated fat consumption is detrimental to our health. Generally, diets containing high amount of saturated fats and restricted in certain essential nutrients, like choline and methionine, have been shown to cause obesogenic changes, and alterations in serum biochemical parameters which can lead to hypercholesterolemia, hypertriglyceridemia and fatty livers in different strains and species of rodents [11]. Obesity as well as fatty liver disease is a common incidence in high fat diet enriched in saturated fatty acids such as butyric acid. When rats are fed with high fat diets, some develop obesity while others display an obesity-resistant phenotype [12]. High fat diets aggravates atherosclerosis, hyperglycemia and renal failure in mice [13], induce rapid increase in plasma total cholesterol level [14] and also lead to concomitant features of the metabolic syndromes like weight gain, decreased HDL levels, hyperinsulinemia, and insulin resistance [15]. Adiposity can be caused by consumption of high fat diets enriched in saturated fat induces, can lead to metabolic complications, as well as increased risk of fatty liver disease [16]. Increased adiposity and insulin resistance contribute to the progression of non-alcoholic steatohepatitis to fibrosis through the development of profibrotic milieu in the liver including increased hepatocellular death [17]. In addition, loss of fur and skin integrity, changes in plasma lipids, and hepatic steatosis can evolve by these diets, independent of atherosclerosis, these suggest that over nutrition with saturated fat like butyrate might play a role in the genesis of obesity related liver problems, fatty change and other risk factors associated with metabolic complications [18] which has been identified as a risk factor for depressive mood, anxiety, and apathy [19] and increased dementia incidence [20]. Mice have been considered as a useful model for the study of human pathophysiology. So far, limited information is available regarding the obesogenic effect of butyric acid considering the blood profile level and liver histology. Therefore, the present research work was designed to determine the effect of butyric acid on body weight gain, the lipid profile and serum glucose status of mice due to butyric acid intake, to investigate the obesogenic effects of butyric acid on liver histoarchitecture.
MATERIALS AND METHODS
Experimental animals
The mice were purchased from ICDDR’B, Dhaka, Bangladesh and housed in a compartmentalized square wooden cage wrapped with wire mesh under controlled conditions of temperature (26-30) °C and relative humidity of 70-80% with natural day light. All the experimental procedures and protocols used in this study were approved by the animal welfare and experimentation ethics committee of Bangladesh agricultural university (No. AWEEC/BAU/2019(28).
Experimental design
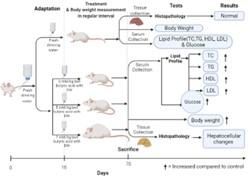
The experiment was conducted in the Department of Physiology, Bangladesh Agricultural University (BAU), Mymensingh. A total 20 male Swiss albino mice (Mus musculus), 6-8 weeks old with an average body weight of 25-27 gm were used. n-Butyric Acid was purchased from Research-Lab Fine Chem Industries, Mumbai 400 002 (India). The mice were randomly divided into 4 groups, each consisted of 5 mice. Control group (A) received only basal mouse pellet feed with fresh drinking water. Whereas Group B, Group C and Group D were administered with 3 mM, 5 mM, and 7 mM/kg body weight (bw) butyric acid respectively, orally mixing with drinking water throughout the experimental period of 60 days. In reference to previous works with butyric acid and related topic, the doses of butyric acid were fixed.
Body weight
Initial body weight of each mouse was measured by using a digital weight balance. Body weight was taken at day 0 of experiment and then 15 days’ intervals until end of experiments. Body weight gain and growth performance was determined by the following formula: weight (g)= mean final weight (g)-mean initial weight (g)
Collection of blood and serum
At the end of the experiment (on 60th day), blood samples were collected by cardiac puncture after overnight fasting. At first, the mice were placed one by one in an airtight container containing diethyl ether pre-soaked cotton. Diethyl ether was purchased from Labscan Asia Co., Ltd., Bangkok10330, Thailand. Then they were being looked over for insensibility and taken out from the airtight vessel and blood was collected directly from heart by a sterile syringe. Firstly, about 1 to 1.5 ml of blood was collected directly from the heart, then 0.5-0.75 ml blood was transferred to an anticoagulant tri-sodium citrate containing tube and the remaining half of blood was transferred to another tube without anticoagulant for serum preparation. Tri-sodium citrate was purchased from Research-Lab Fine Chem Industries, Mumbai 400 002 (India). As per conventional method serum was collected by centrifuging the blood sample at 1500 rpm for 30 min and stored at – 20 °C temperature until tested.
Biochemical studies
Estimation of lipid profile like serum total cholesterol (TC), triglycerides (TG), high density lipoprotein (HDL) and low density lipoprotein (LDL) were performed colorimetrically using Humalyzer 2000 (Human Diagnostic, 65205 Wiesbaden, Germany) following instructions provided by Trinder [21]. The blood glucose level was measured by using Glucose (GOD-PAP) reagent kit (Human Diagnostic, 65205 Wiesbaden, Germany).
Histology
The liver from each group of mice were collected after complete removal of blood by perfusion with phosphate buffered saline and kept in 10% neutral buffered formalin for 24 h. The well-fixed tissues were processed, sectioned and stained with hematoxylin and eosin (H & E) stain as per standard procedure [22] in the Department of Anatomy and Histology, Bangladesh Agricultural University, Mymensingh-2202. The stained slides were observed under microscope (Labomed, Inc., Los Angeles, USA) and photographs of the characteristic findings were taken.
Statistical analysis
Data were continuous and normally distributed. All data were expressed as mean ± SD, and differences among the groups of animals were compared using one-way ANOVA with post-hoc Duncans test [23]. Paired t-tests were used to compare treatment group with control group. Statistical significance was set at P< 0.05. Statistical analysis was performed using SPSS software version 17 (SPSS Inc., Chicago, IL, USA).
RESULTS
Effects of butyric acid on body weight in mice
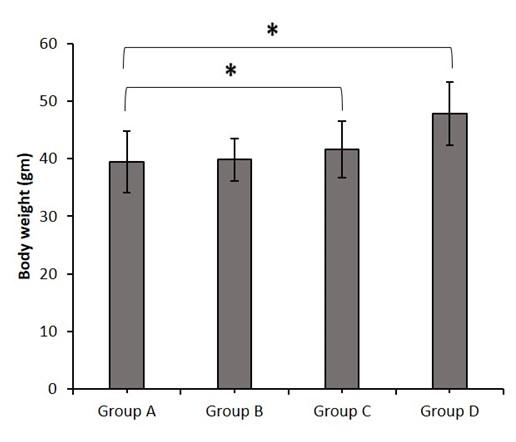
The impact of dietary supplementation of butyric acid on body weight of different groups of mice were presented in Figure 1. The initial body weight of all groups of mice at 8 weeks of age was almost similar (25-27g). At the end of experiment, there was significant (P<0.05) difference in the body weight of group C and D compared to that of control mice. The maximum body weight was recorded in group D at 60th day of experiment.
Effects of butyric acid on serum total cholesterol (TC) in mice
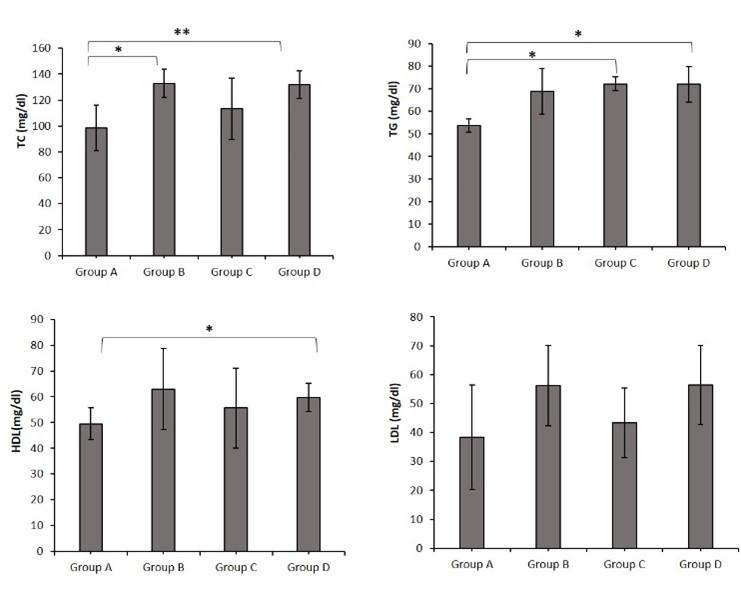
The effect of butyric acid on serum TC level of different groups of mice were presented in the Figure 2. The TC level of group B and group D were significantly increased than control group. On the other hand, the group C (5 mM/kg bw butyric acid) was statistically insignificant.
Effects of butyric acid on triglyceride (TG) in mice
The effect of supplementation of butyric acid on triglyceride (TG) level of different groups of mice were presented in the Figure 2. The TG level of group B was statistically insignificant compared to control group, while TG level of group C and group D were significantly (P<0.05) increased than control group.
Effects of butyric acid on high density lipoprotein (HDL) in mice
The serum HDL level in blood after supplementation of butyric acid in different groups of mice were presented in the Figure 2. The HDL level was recorded in group B and group C were statistically insignificant than control. Whereas group D differed statistically significant (P<0.05) than control group.
Effects of butyric acid on low density lipoprotein (LDL) in mice
The serum LDL level in different groups of mice were presented in the Figure 2. The LDL level of group B, group C, group D increased compared to the control group but not statistically significant.
Effects of butyric acid on blood glucose level in mice
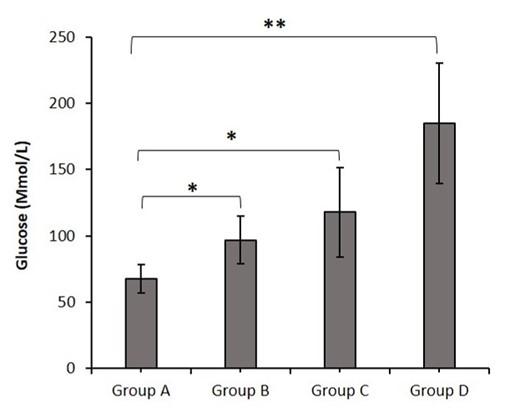
The effects of butyric acid on blood glucose level of different groups of mice were presented in the Figure 3. After the treatment, the serum glucose level of group B, C, and D were significantly higher compared to control group.
Relationship between TC and body weight after the treatment of butyric acid in mice
The Relationship between cholesterol and body weight is presented in Table 1. The result shows that there is a strong negative (correlation coefficient, r = -0.8045) relationship between TC and body weight of control group, that means increase of body weight is not dependent on TC level. The relationship between TC and body weight of Group B is weakly positive, Group C showed weakly negative relationship between cholesterol and body weight. Group D showed strong positive (r= 0.8136) between cholesterol and body weight.
Table 1. Relationship between TC and body weight, glucose and body weight, glucose and TC, TC and TG, glucose and TG after treatment with butyric acid in mice.
Relationship between glucose and body weight after treatment with butyric acid in mice
The relationship between glucose and body weight is presented in the Table 1. The following result shows that in control group there is a weak positive (r = 0.3959) relationship between blood glucose and body weight. The relationship between the blood glucose and the body weight of Group B and C is negative. In group D, the glucose level and body weight are positively correlated, (r = 0.4069).
Relationship between glucose and TC after treatment with butyric acid in mice
The relationship between glucose and TC is presented in the Table 1. The following result shows that in control group, there is a weak positive (r = 0.1913) relationship between the glucose and TC. The relationship between glucose and TC level of Group B is weakly positive (r = 0.0130). There is a positive relationship between glucose and cholesterol levels in group C and group D.
Relationship between TC and TG after treatment with butyric acid in mice
The relationship between cholesterol and triglyceride (TG) is presented in the Table 1. The result shows that in control group there is a weak positive (r = 0.4212) relationship between TC and TG level. In both group B and group D, the relationship between the TG and TC level is weakly negative, but in group C they are strongly positive (r = 0.8960).
Relationship between glucose and TG after treatment with butyric acid in mice
The relationship between glucose and TG is presented in the Table 1. The following result shows that in control group there is a weak positive (r = 0.1214) relationship between glucose and TG. The relationship between the glucose level and TG level in Group B is strongly positive (r = 0.5798) and in group C and Group D it is negatively and positively related, respectively.
Effects of butyric acid on the histopathological alterations of liver in mice
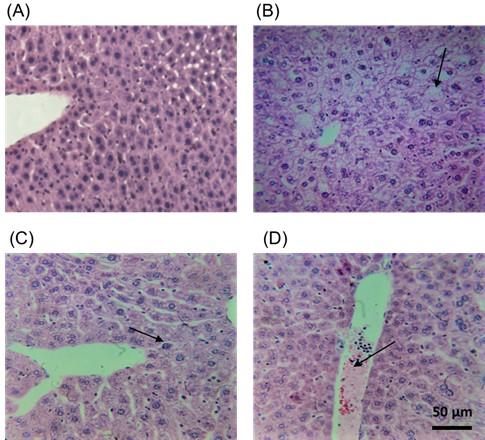
In the present study, histopathology of the liver sample was performed to identify the pathological changes due to exposure of butyric acid. In histology, specific lesions were found in the liver of the most treated groups as compared to the control (Figure 4). Slight hepatocellular degeneration was found in group B (Figure 4B) in comparison to the control group. However, group C (Figure 4C) showed vacuolar degeneration in the cytoplasm of hepatocyte and degeneration of nuclei of hepatocytes. Group D (Figure 4D) showed enlargement of central vein, degeneration of hepatocytes around the central vein and hepatocellular death.
DISCUSSION
The experiment was designed and conducted to determine the effect of butyric acid on body weight gain of mice, to investigate and study its effect on the lipid profile and blood glucose status and investigate its effects on liver histoarchitecture. The initial body weight of all groups of mice at 6-8 weeks of age was almost similar (25-27g). After the treatment of butyric acid body weight differed significantly (p<0.05) from their respective pretreatment values. The maximum body weight was recorded in 7 mM/kg bw butyric acid supplemented mice group at 60th day of experiment. This finding is similar to that of Cho et al. [16] and SarnaLindsei et al. [24] who found that diets of SCFAs facilitate weight gain, a predisposing factor of obesity in various animal models. This result revealed that, the application of butyric acid has significant effect on bw in mice.
In this study, butyric acid caused significant changes in the lipid profile in mice. The TC level of serum was increased in the butyric acid treatment groups than control group. The result can be verified with the study of Ohlsson [25] who reported that the saturated SCFAs increases total plasma cholesterol specially LDL-C. However, group C was statistically insignificant compared to control. This finding is nearly similar to that of Zhao et al. [26], who found that diets rich in SCFAs reduces the serum TC level in male Syrian hamsters [27]. They also stated that oral administration of SCFAs could attenuate fat deposition in weaned pigs via reducing lipogenesis and enhancing lipolysis of different tissues thus decreased the concentrations of TG, TC, HDL-cholesterol. This result revealed that treatment with butyric acid decreases the total serum cholesterol level, but high doses of butyric acid increase the serum cholesterol level in mice. The HDL level in blood after supplementation of butyric acid were statistically insignificant in group B and C than control, whereas group D were statistically significant (P<0.05) than control group. It can be related with some similar findings from Peng et al. [28] who reported that hypertriglyceridemia is associated with incremental atherosclerotic cardiovascular disease. Irani et al. [29] also reported that the use of butyric acid glycerides in diet causes a significant increase in blood triglycerides characterized by elevated TC level in blood plasma. The HDL level in blood after supplementation of butyric acid were statistically insignificant in group B and C, but group D differed statistically significant (P<0.05) than control group. We can relate our study with the finding of Sharma et al.[30], who reported that butyric acid containing ghee produces significant increase in HDL- C levels in North Indian adult population. This result revealed that treatment with butyric acid in diet increased the HDL level in mice. However, Jiao et al.[27] showed that oral administration of SCFAs decreases the concentrations of HDL-cholesterol in pigs. The LDL level of group B, C, and D increased compared to the control group but not statistically significant. These data can be compared with the findings of Nguyen et al. [31] who found that saturated fatty acids reduced LDL-receptors in the liver in rats, resulting in a subsequent elevation of LDL in blood. On the other hand, Mansoub [32] stated that saturated fatty acids decreased LDL level in blood. Comparing our results with the findings of them, it can be stated that we couldn’t’ get expected effect of butyric acid on LDL level in mice. These results revealed that, the application of butyric acid causes rise in the lipid profile in mice.
After treatment, the serum glucose level of all the treated groups were significantly higher compared to control. This results are in agreement with the study of Mozaffarian [33] and Hoefel et al. [34] who reported that in liver, glycogen synthesis and concentration were higher in rats receiving short chain of fatty acid such as butyric acid and normocaloric saturated fat. This result revealed that, the application of butyric acid increases the blood glucose level significantly.
The study expressed some correlations between different parameters. Our result showed that there is a positive relationship (strong positive relationship in high dose group D), between the cholesterol and body weight, when the body weight increase cholesterol level is also increased. which also indicate that when TC level increase the body weight also strongly increased. This result is similar with the result of Hannah et al.[35] who describe that the women with overweight has the elevated TC. The study revealed that there is a positive relationship between the body weight and blood glucose level which may indicate that when glucose level increases the body weight will also be increased. This result is similar with the result of Agrawal et al.[36] who found a positive correlation between fasting blood glucose level and body mass index (BMI). BMI and blood glucose level are positively correlated, and subjects are therefore at risk of obesity and its related conditions. Our study stated that, if the glucose level in blood increase the TC level will be increased dramatically. This result is similar with the result of Asaduzzaman et al. [37] where they stated that increased diastolic blood pressure, serum triglyceride, and cholesterol level were observed to be significantly (p < 0.05) associated with increased blood glucose level, the prevalence of diabetes. The study also suggested that if the triglyceride (TG) level increase the cholesterol (TC) level will also be increased. Miyake and Iizuka [38] also found a strongly positive relationship between the TC and TG level by agarose gel electrophoresis in VLDL, LDL, and VLDL subfractions. According to our study, there is a significant correlation between the blood sugar and triglyceride level. So, the present study indicates that if the glucose level increase the TG level will also be increased. Observation of Zheng et al.[39], Beshara et al. [40], and Lin et al. [41] were familiar with that elevated TG level increased the risk of diabetes, impaired fasting glucose level, and impaired glucose tolerance. The analysis of the correlations revealed that the parameters like TC and body weight, glucose and body weight, glucose and TC, TC and TG, glucose and TG after treatment with butyric acid in mice are positively correlated. Increase in one parameter can causes increase of another.
The histopathological findings of our study indicate that increased concentration of butyric acid causes hepatocellular changes. The study could be compared with some other studies of Cho et al. [16] who stated consumption of high fat diets enriched in saturated fat induces excessive weight gain due to adiposity, which can lead to metabolic complications, as well as increased risk of fatty liver diseases and of who stated that increased adiposity and insulin resistance contribute to the progression from nonalcoholic steatohepatitis to fibrosis through the development of profibrotic milieu in the liver including increased hepatocellular death. NAFLD has been recognized as one of the most prevalent etiologies of chronic liver disease worldwide [42] which is mainly characterized by fat accumulation in the hepatocytes. Such kind of lipid accumulation in excessive amount can develop into non-alcoholic steatohepatitis, cirrhosis, and, finally, hepatocellular carcinoma [43]. Thus, patients with NAFLD have a high risk of progressing to cirrhosis and hepatocellular carcinoma and are at increased risk for liver diseases [44]. The results of histology revealed that butyric acid causes hepatocellular degenerations and increased concentration causes degenerative hepatocellular changes.
CONCLUSION
Butyric acid is an obesogenic agent which causes rise in lipid profile and blood sugar. When the concentration of butyric acid increase, the body weight and the lipid profile also increase. Liver of mice can fight against lower concentration of butyric acid but increase in concentration cause degenerative hepatocellular changes. From the above findings, it can be concluded that although mice can tolerate lower concentrations of butyric acid, higher concentrations of butyric acid may cause hepatocellular changes and rise in the lipid profile and the blood glucose level in mice (Figure 5). These data can be used as a reference for consumption of safe dose of butyric acid in other animals and human being as well.
ACKNOWLEDGEMENTS
This work is funded by Ministry of Science and Technology (MoST), Government of the People’s Republic of Bangladesh.
AUTHOR CONTRIBUTIONS
MK Islam designed and supervised the overall research work; MT Akter performed the research work; MEJ Bhuiyan, KM Sujan, S Akter, and MG Hossain wrote the manuscript and analyzed the data; Z Haque critically overviewed the manuscript. All authors revised and approved the final version of the manuscript.
CONFLICTS OF INTEREST
There is no conflict of interest among the authors.
References
- [1]Morrison DJ, Preston T. Formation of short chain fatty acids by the gut microbiota and their impact on human metabolism. Gut Microbes 2016;7:189–200.
- [2]Pascale A, Marchesi N, Marelli C, Coppola A, Luzi L, Govoni S, et al. Microbiota and metabolic diseases. Endocrine 2018;61:357–71.
- [3]National Center for Biotechnology Information. PubChem Compound Summary for CID 58150421. PubChem 2021.
- [4]Lindmark Månsson H. Fatty acids in bovine milk fat. Food Nutr Res 2008;52:1–3.
- [5]McNabney SM, Henagan TM. Short chain fatty acids in the colon and peripheral tissues: A focus on butyrate, colon cancer, obesity and insulin resistance. Nutrients 2017;9:1–28.
- [6]Joon Yau Leong Ranjith Ramasamy ASP. 乳鼠心肌提取 HHS Public Access. Physiol Behav 2017;176:139–48.
- [7][7] Stilling RM, van de Wouw M, Clarke G, Stanton C, Dinan TG, Cryan JF. The neuropharmacology of butyrate: The bread and butter of the microbiota-gut-brain axis? Neurochem Int 2016;99:110–32.
- [8]Banasiewicz T, Krokowicz, Stojcev Z, Kaczmarek BF, Kaczmarek E, Maik J, et al. Microencapsulated sodium butyrate reduces the frequency of abdominal pain in patients with irritable bowel syndrome. Color Dis 2013;15:204–9.
- [9]Salvi PS, Cowles RA. Butyrate and the Intestinal Epithelium: Modulation of Proliferation and Inflammation in Homeostasis and Disease. Cells 2021;10:1775. https://doi.org/10.3390/cells10071775.
- [10]Di Sabatino A, Morera R, Ciccocioppo R, Cazzola P, Gotti S, Tinozzi FP, et al. Oral butyrate for mildly to moderately active Crohn’s disease. Aliment Pharmacol Ther 2005;22:789–94.
- [11]Koteish A, Diehl A. Animal models of steatosis. Thieme Med Publ Inc 2001;21:89–104. https://doi.org/10.1055/s-2001-12932.
- [12]Zhang X, Zhou D, Strakovsky R, Zhang Y, Pan YX. Hepatic cellular senescence pathway genes are induced through histone modifications in a diet-induced obese rat model. Am J Physiol – Gastrointest Liver Physiol 2012;302:558–64. https://doi.org/10.1152/ajpgi.00032.2011.
- [13]Ghosh SS, Righi S, Krieg R, Kang L, Carl D, Wang J, et al. High fat high cholesterol diet (Western Diet) aggravates atherosclerosis, hyperglycemia and renal failure in nephrectomized LDL receptor knockout mice: Role of intestine derived lipopolysaccharide. PLoS One 2015;10. https://doi.org/10.1371/journal.pone.0141109.
- [14]St-Amand R, Ngo Sock ÉT, Quinn S, Lavoie JM, St-Pierre DH. Two weeks of western diet disrupts liver molecular markers of cholesterol metabolism in rats. Lipids Health Dis 2020;19:1–11. https://doi.org/10.1186/s12944-020-01351-2.
- [15]Hartvigsen K, Binder CJ, Hansen LF, Rafia A, Juliano J, Hörkkö S, et al. A diet-induced hypercholesterolemic murine model to study atherogenesis without obesity and metabolic syndrome. Arterioscler Thromb Vasc Biol 2007;27:878–85. https://doi.org/10.1161/01.ATV.0000258790.35810.02.
- [16]Cho SJ, Jung UJ, Choi MS. Differential effects of low-dose resveratrol on adiposity and hepatic steatosis in diet-induced obese mice. Br J Nutr 2012;108:2166–75. https://doi.org/10.1017/S0007114512000347.
- [17]Chiang DJ, Pritchard MT, Nagy LE. Obesity, diabetes mellitus, and liver fibrosis. Am J Physiol – Gastrointest Liver Physiol 2011;300:697–702.
- [18]Gajda AM, Pellizzon MA, Ricci MR, Ulman EA. Diet-Induced Metabolic Syndrome. Anim Lab News 2007.
- [19]Moretti R, Caruso P, Gazzin S. Non-alcoholic fatty liver disease and neurological defects. Ann Hepatol 2019;18:563–70. https://doi.org/10.1016/j.aohep.2019.04.007.
- [20]Ma Y, Ajnakina O, Steptoe A, Cadar D. Higher risk of dementia in English older individuals who are overweight or obese. Int J Epidemiol 2020;49:1353–65.
- [21]Trinder P. A Simple Turbidimetric Method for the Determination of Serum Cholesterol. Ann Clin Biochem 1969;6:165–6. https://doi.org/10.1177/000456326900600505.
- [22]Cardiff RD, Miller CH, Munn RJ. Manual hematoxylin and eosin staining of mouse tissue sections. Cold Spring Harb Protoc 2014;2014:655–8.
- [23]Steel RGDH, Torrie J. Principles and procedures of statistics a biometrical approach. Auckland: McGraw-Hill International Book Company; 1980.
- [24]SarnaLindsei K, WuNan, WangPengqi, HwangSun-Young, SiowYaw, L. A, Karmin O. Folic acid supplementation attenuates high fat diet induced hepatic oxidative stress via regulation of NADPH oxidase. Can J Physiol Pharmacol 2012;90:155–65.
- [25]Ohlsson L. Dairy products and plasma cholesterol levels. Food Nutr Res 2010;54:0–9.
- [26]Zhao Y, Liu J, Hao W, Zhu H, Liang N, He Z, et al. Structure-Specific Effects of Short-Chain Fatty Acids on Plasma Cholesterol Concentration in Male Syrian Hamsters. J Agric Food Chem 2017;65:10984–92. https://doi.org/10.1021/acs.jafc.7b04666.
- [27]Jiao AR, Diao H, Yu B, He J, Yu J, Zheng P, et al. Oral administration of short chain fatty acids could attenuate fat deposition of pigs. PLoS One 2018;13:1–12. https://doi.org/10.1371/journal.pone.0196867.
- [28]Peng J, Luo F, Ruan G, Peng R, Li X. Hypertriglyceridemia and atherosclerosis. Lipids Health Dis 2017;16. https://doi.org/10.1186/s12944-017-0625-0.
- [29]Irani M, Gharahveysi S, Rahmatian R, Zamani M, Pour VR. The effect of butyric acid glycerides on serum lipids and carcass analysis of broiler chickens. African J Biotechnol 2011;10:11087–92. https://doi.org/10.5897/ajb11.1181.
- [30]Sharma HB, Vyas S, Kumar J, Manna S. Beneficial effect of ghee consumption over mustard oil on lipid profile: A study in North Indian adult population. J Complement Integr Med 2018;15. https://doi.org/10.1515/jcim-2017-0101.
- [31]Nguyen TD, Prykhodko O, Hållenius FF, Nyman M. Monobutyrin reduces liver cholesterol and improves intestinal barrier function in rats fed high-fat diets. Nutrients 2019;11. https://doi.org/10.3390/nu11020308.
- [32]Mansoub NH. Comparitive effect of butyric acid and probiotic on performance and serum composition of broiler chickens. Adv Environ Biol 2011;5:1188–91.
- [33]Mozaffarian D. Saturated fatty acids and type 2 diabetes: More evidence to re-invent dietary guidelines. Lancet Diabetes Endocrinol 2014;2:770–2.
- [34]Hoefel A, Hansen F, Rosa, PD, Assis A, Silveira S, Denardin C, Pettenuzzo L, et al. The effects of hypercaloric diets on glucose homeostasis in the rat: influence of saturated and monounsaturated dietary lipids. Cell Biochem Funct 2011;29:569–76.
- [35]Hannah JS, Jablonski KA, Howard B V. The relationship between weight and response to cholesterol-lowering diets in women. Int J Obes 1997;21:445–50.
- [36]Agrawal N, Kumar Agrawal M, Kumari T, Kumar S. Correlation between Body Mass Index and Blood Glucose Levels in Jharkhand Population. Int J Contemp Med Res 2017;4:1633–6.
- [37]Asaduzzaman M, Chowdhury S, Shahed JH, Kafi MAH, Uzzaman MN, Flowra MT, et al. Prevalence of Type 2 Diabetes Mellitus Among Urban Bihari Communities in Dhaka, Bangladesh: A Cross-sectional Study in a Minor Ethnic Group. Cureus 2018.
- [38]Miyake N, Iizuka K. The relationship of cholesterol (CHO) and triglycerides (TG) in VLDL, LDL, and VLDL subfractions by agarose gel electrophoresis, using CHO and TG dual staining (AG-CHO, TG staining). Rinsho Byori 2002;50:605–12.
- [39]Zheng D, Dou J, Liu G, Pan Y, Yan Y, Liu F, et al. Association between triglyceride level and glycemic control among insulin-treated patients with type 2 diabetes. J Clin Endocrinol Metab 2019;104:1211–20.
- [40]Beshara A, Cohen E, Goldberg E, Lilos P, Garty M, Krause I. Triglyceride levels and risk of type 2 diabetes mellitus: A longitudinal large study. J Investig Med 2016;64:383–7. https://doi.org/10.1136/jim-2015-000025.
- [41]Lin SX, Berlin I, Younge R, Jin Z, Sibley CT, Schreiner P, et al. Does elevated plasma triglyceride level independently predict impaired fasting glucose? the Multi-Ethnic Study of Atherosclerosis (MESA). Diabetes Care 2013;36:342–7. https://doi.org/10.2337/dc12-0355.
- [42]Younossi ZM, Koenig AB, Abdelatif D, Fazel Y, Henry L, Wymer M. Global epidemiology of nonalcoholic fatty liver disease—Meta-analytic assessment of prevalence, incidence, and outcomes. Hepatology 2016;64:73–84. https://doi.org/10.1002/hep.28431.
- [43]Karim, MF, Al-Mahtab, M, Rahman, S, Debnath C. Non-alcoholic Fatty Liver Disease (NAFLD)–A Review. Mymensingh Med J 2015;24:873–80.
- [44]Dulai PS, Singh S, Patel J, Soni M, Prokop LJ, Younossi Z, et al. Increased risk of mortality by fibrosis stage in nonalcoholic fatty liver disease: Systematic review and meta-analysis. Hepatology 2017;65:1557–65.